
Topic 6.1 key terms
- accumulated change
- The total change a rate builds up over an interval: the area between the graph of the rate and the horizontal axis (area above counts positive, below counts negative).
- units of accumulated change
- The rate's units times the input's units: knots × hours = nautical miles, newtons × meters = joules, feet per hour × hours = feet.
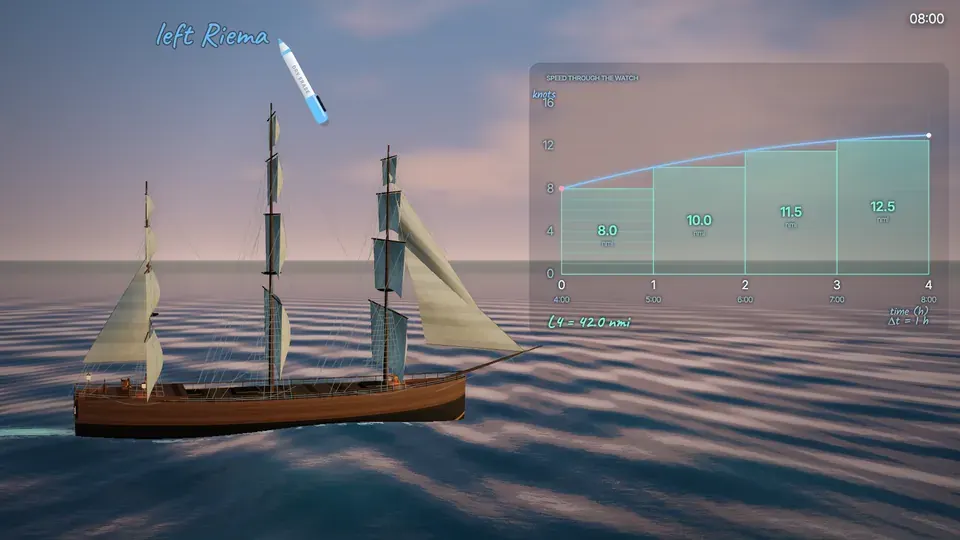
- left Riemann sum
- Rectangles whose heights come from the rate at the LEFT end of each interval, times each interval's width, added up.
- right Riemann sum
- Rectangles whose heights come from the rate at the RIGHT end of each interval, times each interval's width, added up.
- definite integral
- The exact accumulated change: the exact signed area under the rate graph from a to b, written ∫ₐᵇ f(x) dx. Riemann sums approximate it.
- midpoint sum
- Rectangles whose heights come from the rate at the MIDDLE input of each interval.
- trapezoidal sum
- Each interval's width times the AVERAGE of the rate at its two ends; equal to the average of the left and right sums.
- overestimate / underestimate
- An approximation larger / smaller than the integral. Increasing: left under, right over. Decreasing: left over, right under. Concave up: trapezoid over, midpoint under. Concave down: the reverse.
- nonuniform partition
- Intervals of different widths, as in real tables; every rectangle or trapezoid uses its own width.
Transcript
582 words · 2 parts
Eight bells
It’s four in the morning, out on the Atlantic, around the year eighteen hundred, and this ship is running hard for the coast in the dark. That’s eight bells, the start of the morning watch, and the bell will ring eight again when the watch ends, four hours from now. There’s no land in sight, and nothing out here to tell anyone on board where they are.
Every hour, a sailor throws this little wooden chip over the stern, on a line with knots tied along it. He counts the knots that run out while a sand glass empties. Eight knots ran out, so the ship is making eight knots, eight nautical miles an hour. That’s why sailors still measure speed in knots.
That reading goes onto this board as a peg, one for every hour of the watch. From those pegs alone, the navigator has to say how far the ship has come. She’s holding one straight course for the coast, and tonight there’s no current to push her sideways. Somewhere ahead in the dark is the coast, and if his answer comes out too short, the rocks are closer than anyone on board thinks.
By the end of this lesson, you’ll be able to take a list of speeds like these and work out how far you’ve come. You’ll also know when your answer has to be too short, and when it has to be too long. Let’s start the way the navigator starts, with one reading and one hour.
Speed times time
Here’s that first reading on a graph, with speed going up and time going across. The navigator assumes the ship holds eight knots for the whole hour. Eight knots means eight nautical miles every hour, so in that one hour the ship covers eight nautical miles. That’s the area of this rectangle, eight high and one wide. The rectangle on the graph really is a stretch of ocean.
Let’s put it on the board, where we can be careful with it. The height is the speed, eight knots, the width is the time, one hour, and height times width is eight nautical miles.
If the ship holds that speed for only half an hour, the rectangle gets half as wide, and the distance drops to four nautical miles. The width matters just as much as the height. The units tell the same story. A knot is one nautical mile per hour, so knots times hours leaves you with nautical miles, which is a distance.
Say the second hour’s peg reads ten knots. That’s another rectangle, ten times one, so after two hours the ship has come eight plus ten, eighteen nautical miles. Careful. With one-hour widths, it looks like we’re just adding up speeds. We’re not, since each of those numbers is a speed times one hour.
When a graph shows a rate, the area between the graph and the time axis is the change that rate builds up. We call it the accumulated change, and under a speed graph, that’s distance. Sometimes you can find that area exactly with plain geometry. If the speed climbs steadily from eight knots to twelve over two hours, the region is a trapezoid. It’s two hours wide with an average height of ten, so the ship covers twenty nautical miles.
Now you try one. The ship holds six knots for an hour, then speeds up steadily to ten knots over the next two hours. How far does it go in those three hours?