
Topic 6.5 key terms
- accumulation function
- A function defined by a definite integral with a variable limit, such as : for each input x it gives the signed area under f from a to x. Note .
- dummy variable
- The variable inside the integral (t in ). It runs from a to x and never appears in the answer; the input of the accumulation function is the limit x.
- Fundamental Theorem of Calculus, Part 1
- If f is continuous on an interval containing a, then for x in the interval: the rate the accumulated area grows is the height of f at the moving edge.
- chain rule with a variable limit
- : the height at the moving limit times how fast the limit moves.
- relative maximum of an accumulation function
- has a relative maximum where changes from positive to negative. A zero of f without a sign change is not enough.
- concavity of an accumulation function
- Since , g is concave up where f is increasing and concave down where f is decreasing; g has a point of inflection where f changes between increasing and decreasing.
- initial amount plus accumulated change
- An amount whose rate of change is r satisfies ; the constant A(0) does not change the derivative, so .
Transcript
1,750 words · 5 parts
When does it stop?
Let’s go back to the lake and answer the question we started with, and this time you’re in charge of the gate. Drag the gate along the summer and stop it at the week when this lake is at its very highest.
If your sketch peaked at week two back at the start, you’re in very good company, because that’s where the lake rises fastest. But fastest isn’t highest, and for those two weeks in between, the lake keeps rising, just more and more slowly. Look at the layer the lake gains each week. It’s one foot, then three, then three again, then just one, and after that the layers start coming off the top instead.
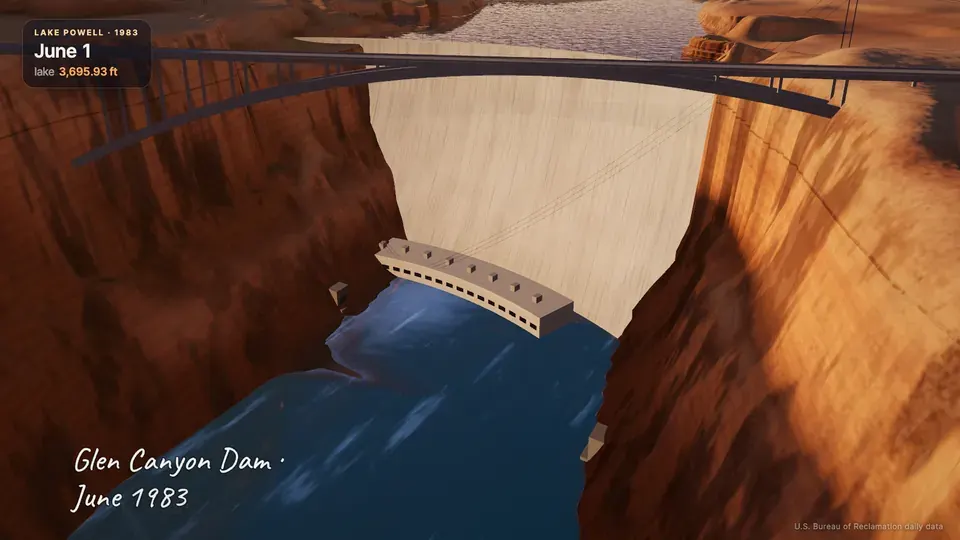
While the layers keep getting bigger, the level climbs faster and faster and its graph bends upward. Once they start getting smaller, the lake still rises, but its graph bends over, and that’s what Lake Powell did in the first week of June, 1983. Now watch what happens if we start counting at week four instead of week zero. The lake doesn’t move at all, but the eight feet before week four don’t count any more, so the whole g graph drops eight feet, and its slope at every week stays the same.
Let’s put the whole picture on the board, with g on top and its rate, r, underneath, lined up week by week. Since g prime is r, wherever r is above the axis, g is going up, and wherever r is below the axis, g is going down. At week four, r changes from positive to negative, so that’s where g reaches its top, and that works for any graph like this one, lake or no lake.
Because r is the slope of g, wherever r is going up, g is concave up, and wherever r is going down, g is concave down. So g changes the way it bends at weeks two and six, right where r turns around. That’s the whole toolkit in one table. The sign of r tells you whether g is going up or down, and whether r is going up or down tells you which way g bends.
For the lake’s actual level, we just put the starting level in front, three thousand six hundred ninety-two feet plus the change since week zero. Now t marks the gate, so I’ve let a new letter, s, do the walking inside the integral. The starting level is a constant, so H prime is still r. When an AP question says justify, the graders want a sentence that names the derivative and says what its sign does.
I’d write, because H prime of t equals r of t, and r changes from positive to negative at t equals four, H has a relative maximum at t equals four. To call it the highest point of the whole summer, check the two ends as well. The lake starts at three thousand six hundred ninety-two, and at week four it’s that plus eight feet of area, three thousand seven hundred. By week eight it’s back where it started, so week four wins.
One warning, because this one costs people points. A rate of zero on its own doesn’t prove a maximum. If r just touched zero and went right back up, the lake would pause for a moment and then keep rising, so it’s the change of sign that makes the maximum. Let’s check that you can read it. At week five, which of these describes the lake?
The burn, backwards
Now, if you took precalc with us, you’ve met these tanks before. This is a Falcon 9 first stage, cut open, with liquid oxygen on top and kerosene underneath. Back then we read how fast the propellant drains from the slope of the top graph. Today let’s go the other way and start from the burn rate, how many tonnes the engines burn every second, which we’ve modeled from the engines’ published specs.
In the first thirty seconds the engines burn two point seven tonnes a second, so the area under that graph is a rectangle, thirty times two point seven, or eighty-one tonnes. That takes the tanks down from four hundred eleven tonnes to three hundred thirty.
The propellant on board is an accumulation function with a starting amount in front. P of t is four hundred eleven minus the integral from zero to t of b of s, d s. From thirty to sixty seconds the shaded area comes in three pieces, and they add up to sixty-nine point four tonnes, so two hundred sixty point six tonnes are left.
We just worked out how much propellant is left at sixty seconds. Now tell me how fast that amount is changing right at that moment. What’s P prime of sixty?
Just before Max-Q, when the air pushes hardest on the rocket, the engines throttle down. The burn rate drops from two point seven to one point nine. That means P prime, which is minus the burn rate, climbs from negative two point seven up to negative one point nine, and a slope that’s rising makes the propellant curve bend upward, right at this knee. The throttle is yours now, so take it and make the propellant curve bend upward.
Functions nobody can write down
This bell-shaped curve is e to the negative t squared, and its area function, G of x, the integral from zero to x, is famous for a strange reason. No formula built from the usual pieces, powers, roots, exponentials, logs or trig functions, can ever write it down. It’s still a perfectly good function, with one area for every x, and a close cousin of it turns bell curves into probabilities in statistics.
Now ask for its derivative, and the Fundamental Theorem hands it to you in one line, e to the negative x squared, without ever finding a formula for G. The same rule that ran our lake works even when no formula built from the usual functions can write the area down. A really common slip is to subtract the integrand at the bottom limit as well. The bottom limit only sets where the counting starts, so it’s a constant, and it disappears when you take the derivative.
Now let’s make the gate’s position depend on x. In the integral from zero to x squared of cosine of t, d t, the gate sits at x squared, so it moves at a rate of two x, the derivative of x squared.
We take the height at the gate, cosine of x squared, and multiply by how fast the gate moves, two x, which is just the chain rule. If x is the bottom limit instead, we flip the integral around first. Sweeping the same strip in the opposite direction flips the sign, so the derivative is negative f of x.
Let’s see if you can put the pieces together. Find the derivative of the integral from one to x cubed of the square root of one plus t squared, d t.
How the exam asks it
This is exactly how the AP exam likes to ask it. They hand you the graph of f, made of line segments and a semicircle, and they define g of x as the integral from negative two to x of f of t, d t.
The first thing I do is put a pin at negative two, because that’s where the counting starts, so g of negative two is zero, even though the graph doesn’t start there. For g of negative four, the top limit is to the left of the start, so we’re sweeping backwards, and that flips the sign.
The triangle from negative four to negative two has an area of two above the axis, so g of negative four is negative two. For g of two we sweep forward from the pin, and both triangles sit under the axis, so that’s negative two plus negative two, negative four. The semicircle then adds half of pi times two squared, two pi, so g of six is two pi minus four, about two point two eight.
Let’s do the next part together. Where is g increasing? Since g prime is f, that’s wherever f is above the axis, from negative four to negative two and from two to six. At x equals negative two, g has a relative maximum, because g prime equals f changes from positive to negative there. By the same reasoning, it has a relative minimum at x equals two, where f changes from negative to positive.
Now you try the one people find hardest. At which x-values does the graph of g have a point of inflection?
The real summer
Before the real data, I’ve got one more challenge for you. The plywood on the gates topped out at three thousand seven hundred four feet, four feet above where our model lake peaks. Reshape the rate graph so this lake peaks exactly at the top of the plywood.
Now you can use the lake’s own rate record to find its highest level. This is the real graph from 1983, how many feet Lake Powell rose each day, straight from the Bureau of Reclamation’s records. Drag the gate through the summer and find the day the lake reached its highest level.
Now we know the date, so how high did the lake get? The area under the daily rates from June first to July fourteenth adds up to about twelve point four feet. The lake started June at about three thousand six hundred ninety-six feet, so it topped out at about three thousand seven hundred and eight, the highest Lake Powell has ever been, and the gauge on the dam agrees.
By then the crews had swapped the plywood for steel boards, eight feet tall. Before the next year’s runoff, engineers cut air slots into the spillway tunnels to stop the rushing water from tearing them apart again.
Let’s put it all together. An integral with a moving top limit is a function, a running total of everything up to the gate, and its derivative is the height of the curve right at the gate.
Because g prime equals f, g climbs wherever f is positive and peaks where f changes from positive to negative, and whether f is rising or falling tells you which way g bends. That’s how you can look at a graph of how fast something is changing, plus one starting value, and say exactly when it peaks, and how high it gets.