
Topic 5.8 key terms
- graph of f′
- The graph whose height at each x is the slope of f at that x. Its sign tells you whether f is increasing or decreasing; whether it is rising or falling tells you the concavity of f.
- second derivative f″
- The derivative of f′: the slope of the graph of f′. It tells you how the slopes of f are changing.
- relative maximum (from f′)
- If f is continuous at c, f′ changing from positive to negative at c gives f a relative maximum there (the first derivative test).
- relative minimum (from f′)
- If f is continuous at c, f′ changing from negative to positive at c gives f a relative minimum there.
- concave down
- The slopes of f are decreasing: f′ is decreasing. f″ < 0 throughout an interval is enough to guarantee it; an isolated zero of f″ need not change the concavity.
- concave up
- The slopes of f are increasing: f′ is increasing. f″ > 0 throughout an interval is enough to guarantee it (x⁴ is concave up even though f″(0) = 0).
- point of inflection
- A point where the graph of f changes concavity: f′ changes from increasing to decreasing or back (f″ changes sign). f″ may fail to exist there.
- critical point
- An input in the domain of f where f′ is zero or does not exist. It is only a candidate for a relative maximum or minimum; if f is continuous there, f′ changing sign settles it.
- inflection candidate
- An input where f″ is zero or does not exist. It is an inflection point only if f is continuous there and its graph changes concavity (f′ changes between increasing and decreasing).
- same derivative, shifted graph
- f and f + C have the same derivative, so f′ fixes the shape of f; one known value of f fixes its height.
Transcript
1,585 words · 5 parts
The twinkle
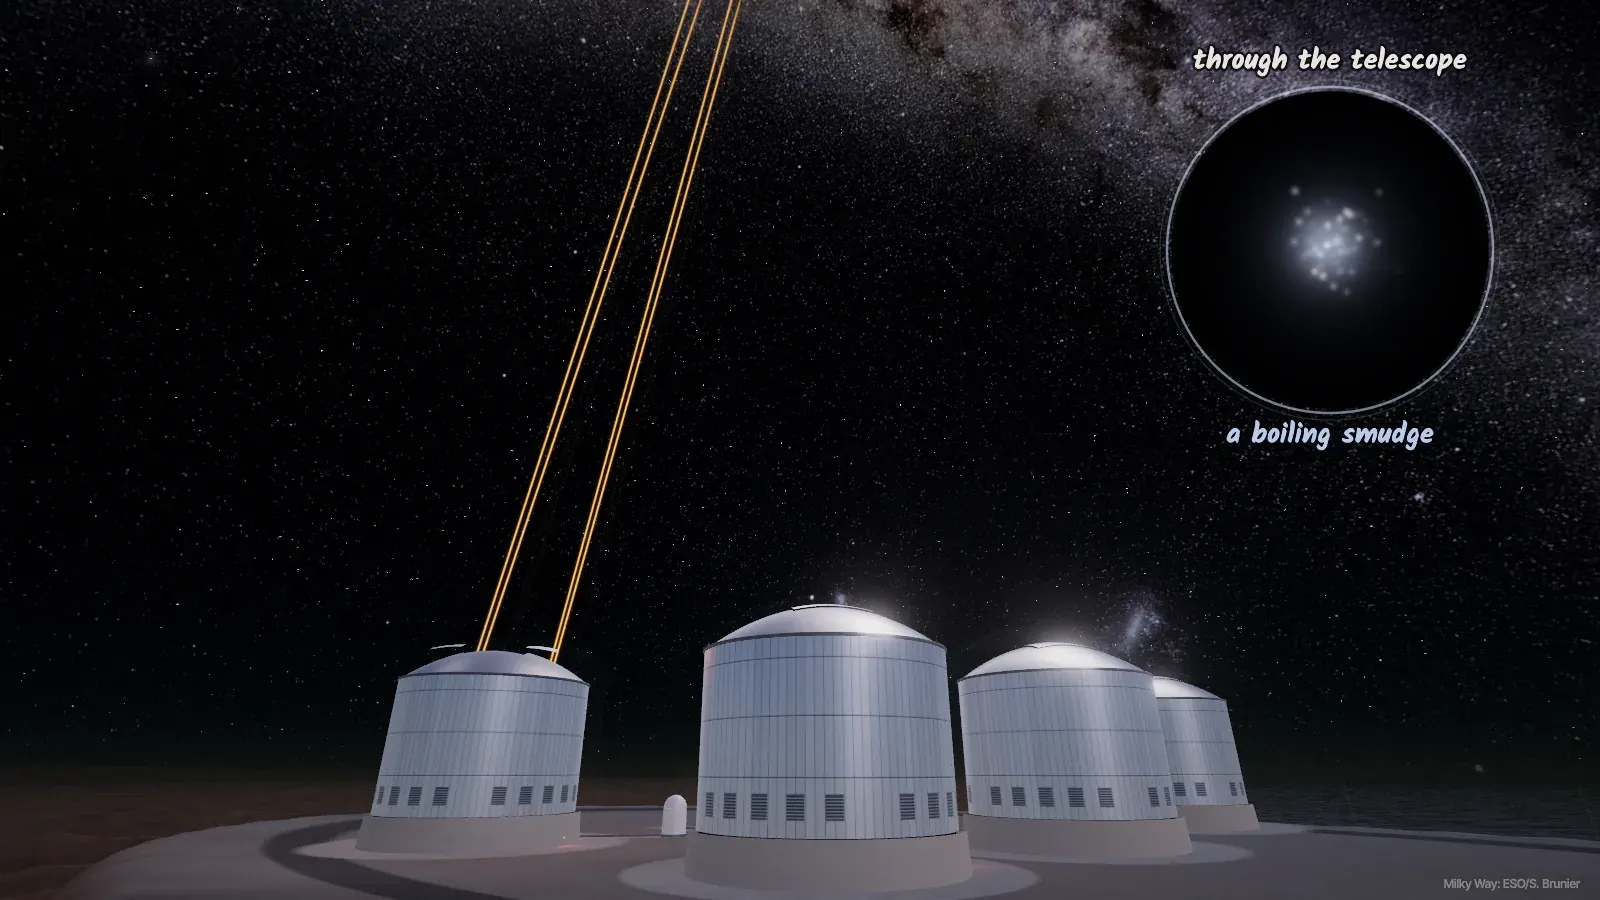
This is the top of Cerro Paranal, a mountain in the Atacama Desert in Chile, and those four buildings hold some of the biggest telescopes on Earth, each one with a mirror more than eight meters across. Those orange beams are lasers, and each one lights up a thin layer of sodium atoms about ninety kilometers up, which gives the telescope its own artificial stars to watch, bright points of light its sensor can always see.
Why would anyone need a fake star? Every star you’ve ever seen twinkles, and it isn’t the star doing it. Its light travels for years without a scratch, and then the last twenty kilometers of our own air smear it. Picture the starlight arriving as flat sheets, and the moving air putting dents in them. The telescope can’t measure those dents directly, though, because its sensor only measures slopes, how tilted the light is under each one of its tiny lenses.
From nothing but those slopes, a computer works out the shape of the dent and bends a mirror just two millimeters thick to cancel it, about a thousand times every second. Look what that does to Neptune. By the end of this lesson, you’ll be able to do what that computer does. You’ll look at nothing but a graph of slopes and draw the shape it came from, every peak, every valley and every place it bends.
Slopes become heights
Let’s freeze the light for a single instant and take one slice through it. The blue curve is the height of the light across the beam, and under it sits a row of tiny lenses, each one focusing its little piece of light down to a bright dot.
Where the light is tilted steeply, like right here at the left edge, the dot slides a long way, and light tilted the other way slides its dot the other way. Up at the crest, where the light is flat right there, the dot sits dead center. Now let’s take every dot’s shift and stand it up as a height, and the heights line up into a brand new curve, which is the only thing the computer ever gets to see.
That new curve is a graph you already know, the derivative of the blue curve, f prime, so let’s take both of them to the board and read them carefully. Our slice of light is f of x equals x cubed over three, minus two x squared, plus three x. The power rule gives f prime of x equals x squared minus four x plus three, which factors into x minus one, times x minus three.
At x equals zero the tangent line on f climbs with a slope of three, and right below it the orange graph sits at a height of exactly three. Slide along and it keeps happening. At one the tangent is flat and f prime is zero, and at two the curve falls with a slope of negative one, so f prime is down at negative one.
At three it’s flat again, so f prime is back to zero, and at four the slope is three, just like at the start. If you remember one thing from today, make it this, the height of the bottom graph is the slope of the top graph, at every single x.
Let me ask you something before we go on. The orange graph, f prime, reaches its lowest point at x equals two, so what do you think the blue curve f is doing right at that spot?
We can do the exact same move one level down. The slope of the orange graph becomes the height of a third graph, the second derivative, f double prime. Since f prime is x squared minus four x plus three, f double prime is two x minus four. f double prime tells us how the slopes of f are changing. It’s negative until two, while the slopes of f keep going down, and positive after two, while they go back up.
What slopes can’t see
There’s one thing the slopes can never tell us, so watch the dots while I slide the whole slice of light upward. Not a single one of them moves. Sliding the light up or down doesn’t change a single slope, so the sensor is completely blind to it. Astronomers call that shift piston, and on paper it’s just adding a constant, plus C.
Luckily the telescope doesn’t care, because moving all the light together doesn’t blur anything. The computer bends the mirror into the opposite shape, the dent cancels out, and the star snaps back into a point.
On paper it looks like this. f, f plus two and f minus one all have the same derivative, this one orange curve, because adding a constant never changes a slope. That means f prime gives you the shape, and you need one actual point on f to pin down the height.
Suppose g has exactly the same derivative as our f, and g of zero equals five. Our f has f of zero equal to zero and f of three equal to zero, so what is g of three?
When zero isn’t enough
You met two traps in earlier lessons, and they come back every time you read a graph of f prime. Take f of x equals x cubed. Its derivative is three x squared, which equals zero right at x equals zero. It’s tempting to stop right there and call that a maximum or a minimum. But f prime is positive on both sides of zero, so x cubed climbs, flattens out for an instant, and then keeps right on climbing.
A zero of f prime is only a candidate. f prime changing from positive to negative gives you a maximum, and from negative to positive a minimum, but this f prime doesn’t change sign at all. Its concavity does flip from down to up, though, so x cubed has an inflection point at zero.
The same trap shows up one level down, with last lesson’s x to the fourth. Its f double prime is twelve x squared, which is zero at zero. But it’s positive on both sides, so x to the fourth is concave up the whole way and has no inflection point at all.
Whichever derivative you’re reading, a zero is only a candidate. What settles it is a sign change, so f prime changing sign gives you a peak or a valley, and f double prime changing sign gives you a bend. The graph of f prime touches the x-axis at x equals two and stays positive on both sides of it, so what does f have at x equals two?