
Topic 1.3 key terms
- position–time graph
- The position of an object plotted against time: the motion with time unrolled. Its slope at any instant is the velocity.
- tangent line
- A straight line that touches a curve at one point and has the curve’s steepness there. On an x–t graph its slope is the instantaneous velocity.
- instantaneous velocity
- The rate of change of position at one instant: the slope of the line tangent to the x–t graph at that time.
- instantaneous acceleration
- The rate of change of velocity at one instant: the slope of the line tangent to the v–t graph.
- area under a v–t graph
- The displacement during that time interval; area below the time axis counts as negative.
- area under an a–t graph
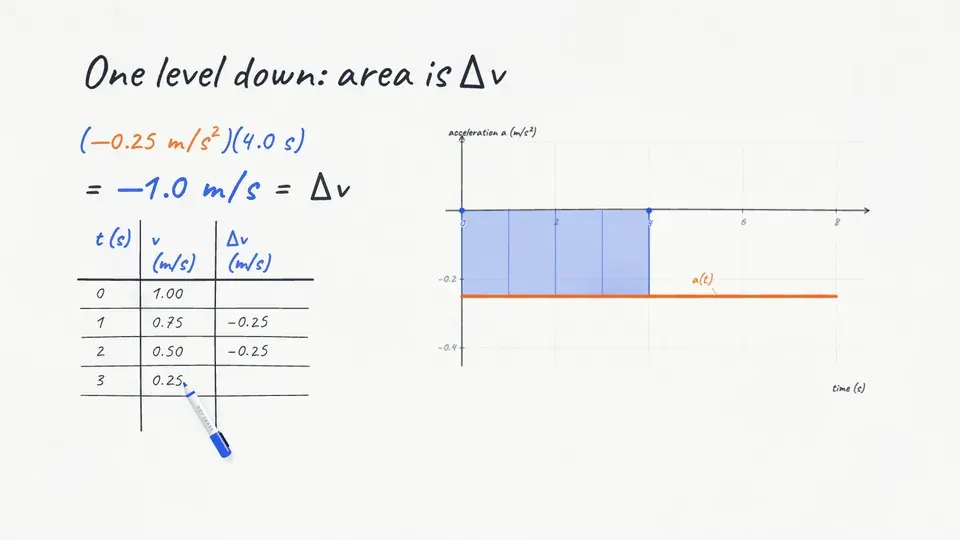
- The change in velocity during that time interval.
- motion diagram
- Dots showing an object’s position at equal time intervals, usually with velocity arrows on the dots and an acceleration arrow.
- kinematic equations
- v = v₀ + at, x = x₀ + v₀t + ½at², v² = v₀² + 2a(x − x₀): valid only when the acceleration is constant.
- acceleration due to gravity, g
- g is the magnitude of the free-fall acceleration near Earth’s surface: the AP exam uses g ≈ 10 m/s² (9.8 and 9.81 are also accepted). The acceleration itself points down, so with up positive a = −g. On the Moon, g = 1.62 m/s².
- non-uniform acceleration
- Acceleration that changes with time, like a feather falling through air toward its terminal speed. AP Physics 1 treats it qualitatively: sketch it and describe it.
- justify
- AP task verb: give qualitative reasoning beyond the math, a claim plus the evidence and physics that support it.
Transcript
3,007 words · 10 parts
On the Moon, 2 August 1971
On the second of August, 1971, near the end of their last moonwalk, Commander David Scott stood in front of a TV camera on the Moon, holding a falcon feather in his left hand and a geologic hammer in his right. For almost two thousand years, people believed Aristotle, who taught that heavier things fall faster. Here’s what Scott told everybody watching back on Earth.
By the end of this lesson, you’ll be able to predict how long that hammer takes to hit the ground and check your prediction against the film from 1971, and you’ll be able to look at any graph and see the motion in it, and look at any motion and draw its graphs. Galileo couldn’t go to the Moon, or time a falling ball, which was far too quick for any clock he had, so he slowed gravity down with a ramp, and that’s where we’ll start.
Galileo’s ramp
Here’s a ramp, tilted by just one and a half degrees. And this glowing arch is eight seconds in the life of a cart on it. Let’s turn around and watch it happen. One shove up the track, and the cart climbs, stops for an instant, and rolls all the way back.
Now let’s swing back to the side and run it again, letting time push the cart’s trail sideways, and there’s our arch, built one instant at a time. That arch is a graph, and it’s the motion itself, with time unrolled.
Pick any moment, like two seconds in, and the cart was one and a half meters up the track, exactly as high as the arch. Four seconds later it passed that same spot on the way back, so the arch is just as high again. Underneath, the cart traces the same eight seconds again, as its velocity and as its acceleration.
Reading a position graph
We’ll start simple. I’ll switch on the cart’s motor and drive it up the track at a steady quarter of a meter every second. Now I’ll drive it four times faster, at one meter per second, and the line comes out four times steeper. When I park the cart, its position stays the same, so it draws a flat line. Now I’ll drive the cart back toward the start, so its position decreases and the line tilts down.
Here are those four runs redrawn on the board, and the steepness is how fast the cart goes while the tilt is which way, so together they make the velocity, and that’s why the slope of a position graph is the velocity. Here’s a graph that catches a lot of people, and it’s exactly the kind of graph the AP exam likes to test you on. The position climbs in a straight line for four seconds, so what does this graph tell you about the cart?
Here’s the cart driving at a steady half meter per second, and it draws exactly that line. The graph tracks the cart’s position number, and it isn’t a picture of the track, so there are no hills in it.
Okay, now you drive. Work the velocity stick so the cart’s line lands right on top of this faint target graph, and think about the slope each piece needs before you press record.
For a real challenge, try the same game with an accelerator pedal. Then you only control how fast the velocity changes, the slope of the slope. Our arch isn’t straight anywhere, so its steepness changes from instant to instant. We lay a straight edge against it that touches the curve at just one moment, a tangent line, and its slope is the velocity at that instant.
Watch the tangent ride the arch, steep at the start and gentler as the cart climbs, flat at the very top, then tipping down as the cart comes back. At the top the tangent is flat, so for that one instant the velocity is zero, and hang on to that instant, because something sneaky happens there.
Here’s the cart a fifth of a second before the top and a fifth of a second after. It’s in the same place both times, but one velocity arrow points up the slope and the other points down, and that’s nothing like a cart that’s really parked, with no velocity and no acceleration at all.
The slope of the slope
Let’s bring the arch onto the board and measure it. Here it is, drawn exactly, with time in seconds across the bottom and position in meters up the side. At the start, the tangent’s slope is one meter per second. Two seconds later, it’s down to half a meter per second.
At four seconds it’s zero, at six it’s negative half a meter per second, and at eight seconds it’s negative one meter per second, the negative sign telling us the cart is heading back down. Now let’s plot those five slopes on their own graph, velocity against time, and look at that, they all fall on one straight line, the cart’s velocity graph, built entirely out of slopes.
The velocity drops by a quarter of a meter per second every second, so the slope of this line is negative zero point two five meters per second squared, and that’s the cart’s acceleration. So the acceleration graph is a flat line. The slope of the position graph is the velocity, and the slope of the velocity graph is the acceleration.
Now back to that sneaky instant at the top. A lot of people say the cart is stopped there, so its acceleration has to be zero too. But the velocity graph slices straight through zero at four seconds without even bending, so the velocity is still changing there, from positive to negative, and the acceleration stays at negative zero point two five meters per second squared, even as the velocity passes through zero.
Now you go from one graph to another. This cart starts from rest, speeds up steadily for three seconds and then cruises, so its position graph curves up and then straightens. Which one is its velocity graph?
Areas run it backward
Slopes take us down from position to velocity to acceleration, so let’s go back up. We’ll color in the area under the velocity graph as the cart climbs, and watch the green arrow on the track, its displacement.
The area grows, and the arrow grows right along with it, step for step, and at the top both of them say two meters. Then the velocity turns negative, so the new area lands below the axis and counts as negative, and it eats the old area away just as the cart gets back to its start.
Let’s check that on the board. The area for the first four seconds is a triangle, one half times four seconds times one meter per second, which is two meters. And seconds times meters per second leaves just meters, which is why the area under a velocity graph can be a displacement. The second triangle sits below the axis, so it’s negative two meters, and the total displacement is zero, just as the cart ended where it began. The distance is still four meters, because distance is a scalar that only counts up.
Let’s try an elevator. It starts from rest, speeds up to two meters per second in two seconds, cruises for six seconds, then slows to a stop in two more. How high does it rise, in meters?
One level down it works the same way. Under the acceleration graph, four seconds times negative zero point two five meters per second squared is negative one meter per second, the cart’s change in velocity from one meter per second to zero. In one big study, this was the hardest graph skill on the whole test. Fewer than one student in four got it right. So let’s see it as nothing more than the area of a rectangle.
Here’s that same rectangle, one second at a time. Every second, the acceleration takes another quarter of a meter per second off the velocity, So one meter per second becomes three quarters after one second, a half after two, a quarter after three, and zero after four, and those four slices of negative a quarter add up to the whole rectangle, negative one meter per second.
Now one where the starting velocity isn’t zero. A cart is moving at negative two meters per second when this acceleration acts on it, plus two meters per second squared for three seconds and then nothing. What is its velocity at five seconds, in meters per second?
One motion, five ways
There are five ways to represent a motion, and the AP exam expects you to move between all of them. In words, we shove our cart up a gentle ramp at one meter per second, and it stops two meters up before rolling back. As a figure, it’s a sketch of the ramp with an axis. Zero is at the start, and positive points up the slope.
As a motion diagram, it’s a dot every second, with velocity arrows that shrink to nothing at the top, and one acceleration arrow pointing down the slope the whole time. Now divide each gap between the dots by the smallest one, and you get seven, five, three and one, the odd numbers, counting down to the top.
Galileo found this pattern by rolling balls down ramps, and he published it in 1638. Starting from rest with a constant acceleration, the distances in equal times go like the odd numbers, and our cart runs that pattern backward as it comes to rest at the top. You’ve already seen its graphs. The fifth way is an equation, and we’ll build it next.
Three equations from one graph
Here’s any motion with a constant acceleration, drawn as a velocity graph. It starts at v naught and climbs in a straight line to v after a time t. Its slope is the acceleration, so a equals v minus v naught, over t, and rearranging that gives the first equation, v equals v naught plus a t.
The area under the line is the displacement. It’s a rectangle, v naught times t, plus a triangle with base t and height a t, and that triangle’s area is one half a t squared. That displacement is x minus x naught. Move x naught across, and you get the second equation, x equals x naught plus v naught t plus one half a t squared.
Let’s try the second equation on our cart. It starts at x naught equals zero, moving at one meter per second, with an acceleration of negative zero point two five. Now put those numbers in. Half of negative zero point two five is negative zero point one two five, an eighth. That gives our cart’s equation, the fifth way to describe its motion.
Now you try it with our cart’s equation. Where is the cart at four seconds, in meters? The third equation uses this same area, but it takes the time out. It says v squared equals v naught squared plus two a times x minus x naught.
We’ll skip that algebra. This one has no t in it at all. All three are on the AP equation sheet, and they only work for constant acceleration. I pick the one that has my unknown and nothing else I don’t know.
Before I work one out, you pick. The cart starts up the ramp at one meter per second, stops at the top, and accelerates at negative zero point two five meters per second squared, and we want to know how far up it goes. Which equation should we use?
Now let’s work it out properly. I always start with a sketch and an axis, zero at the bottom and positive up the slope. It starts at positive one meter per second, stops at the top, and accelerates at negative zero point two five meters per second squared, down the slope. The unknown is the displacement.
Nobody told us the time, so I want the equation without a t in it, the third one. I’ll put in the velocities and the acceleration with their units, so we can check that the answer comes out in meters. The top and the bottom of that fraction are both negative, so the displacement comes out positive, two meters up the ramp.
It’s positive, so the cart ends up the slope, and it’s the same two meters we got from the triangle’s area. Getting the same displacement from the graph and from the equation is a strong check on our work.
Galileo’s question, on the Moon
Back to the Moon, where we left the hammer and the feather hanging in midair. Before we let them land, let’s work out when they should. Here’s the fall so far, with a flash every three tenths of a second, and the gaps between the ghosts are about seven centimeters, then twenty-two, then thirty-six. That’s one, three, five, Galileo’s from-rest pattern counting up, the same odd numbers our cart ran backward on its ramp, so the next gap should be seven, about fifty-one centimeters, which is almost exactly the distance left to the ground.
Here are the fall’s graphs. The position curves down like the back of our arch, the velocity is a straight line growing more negative, and the acceleration is flat at negative one point six two meters per second squared.
Now let’s predict the fall, like I promised, and put it on the board. With up positive and zero on the ground, the hammer’s displacement is negative h, it starts from rest, and its acceleration is negative g.
The second equation says negative h equals zero plus one half times negative g times t squared, and the two minus signs cancel, so t squared is two h over g, and since the time that has passed can’t be negative, we take the positive square root. Only the height and g are in that answer, nothing about the hammer or the feather, so with no air, a hammer about a thousand times heavier lands with the feather.
Now you predict it. Scott held them about one point two meters above the ground, and the Moon’s g is one point six two meters per second squared, so how long did the fall take, in seconds, to two significant figures?
So let’s go back to the Moon and let him finish. Here it goes, from his hand, in real time. About one point two seconds, the same two figures you got. In NASA’s video the hammer falls for thirty-six frames at thirty frames a second, which is one point two seconds, give or take a frame, so you just predicted a fall on the Moon from 1971.
Now let’s take the same hammer to three more worlds. We’ll drop it from the same height on all four at once. Jupiter takes three tenths of a second, Earth half a second, the Moon one point two. Near Earth, a falling object accelerates downward, and on the exam the size of that acceleration is about ten meters per second squared, though the exam also takes nine point eight.
Jupiter’s g is fifteen times the Moon’s, but its fall is only about four times quicker, because time goes as one over the square root of g. Now let’s come back to Earth, into NASA’s biggest vacuum chamber, and this time we’ll leave the air in.
Before we drop them, picture the feather falling through the air. What will its velocity graph look like? Here it goes. The feather flutters, and its velocity graph bends over and goes flat, because the air pushes back harder the faster it falls.
That’s its terminal speed, where the size of the acceleration has shrunk to zero. For acceleration that changes like this, the exam won’t ask you for numbers, only to describe the motion and sketch its graphs, so picture a velocity curve that flattens out, and, with up positive, an acceleration graph that climbs from negative nine point eight up to zero. Now pump the air out of the chamber. This time, the feather falls right beside the hammer.
Okay, the controls are yours. Pick any world and set the height so the hammer’s fall lasts exactly two seconds, which means solving our equation for h first, and once one world works, see whether you can do all four. On the Moon two seconds takes about three and a quarter meters, and on Jupiter almost fifty, because the height has to grow in step with g to keep the same two seconds.
Justify it like the exam
The AP exam loves the word justify, and it means something specific there, so let’s practice at the top of the ramp, where the velocity is zero. A student claims that the cart’s acceleration at the top is zero, because the cart isn’t moving there. Here are four responses, so which one would earn full credit?
Time, unrolled
Let’s put the whole lesson back together on one board. A graph is the motion with time unrolled, so read what the axes measure, because the curve tells you how the motion changes and it never draws the track.
The slope of the position graph is the velocity, and the slope of the velocity graph is the acceleration. The area under the velocity graph is the displacement, and the area under the acceleration graph is the change in velocity. For constant acceleration, the three equations on your sheet describe the motion, and near Earth that acceleration is about ten meters per second squared, downward.
And we can describe the same motion with words, a figure, a motion diagram, graphs and an equation, and each one has to agree with the others. Galileo needed a ramp to slow gravity down, and David Scott needed the Moon to get rid of the air, but you can see a falling hammer’s whole story in one graph, with time unrolled. Later in this unit we’ll throw the hammer sideways, and then it will need two sets of graphs at once, one for across and one for down.