
Topic 7.3 key terms
- equilibrium position
- Where the object would sit at rest, with zero net force on it. In SHM, x is measured from here.
- amplitude
- The biggest displacement from equilibrium, , measured from the middle to one end. End to end is ; one full cycle covers .
- displacement from equilibrium
- The signed position of an oscillating object measured from its equilibrium position (CED 7.3.A.1).
- frequency
- Full cycles per second, , in hertz. .
- x = A cos(2πft)
- Position in SHM when the object is released from rest at at . is the same motion with the clock started at equilibrium. is an angle in radians.
- reference circle
- SHM is the shadow of uniform circular motion: a point turning once per period on a circle of radius projects onto a line as .
- maximum speed
- , reached at the equilibrium position, where the acceleration is zero. Not on the equation sheet: one circumference per period.
- maximum acceleration
- , reached at the turning points , where the velocity is zero, pointing toward equilibrium.
- amplitude independence
- Changing the amplitude of a system in SHM does not change its period (CED 7.3.A.2); and are proportional to .
- radial velocity
- The part of a star's velocity along our line of sight, measured from the Doppler shift of its light. 51 Pegasi's is a sine wave of amplitude 55.9 m/s and period 4.23 days.
Transcript
3,518 words · 10 parts
The star that waved
In the autumn of 1994, on a dark plateau in the south of France, two astronomers from Geneva, Michel Mayor and Didier Queloz, were measuring one thing about star after star, how fast each one was moving toward us or away from us. One of those stars, 51 Pegasi, a star you can just about see without a telescope, wouldn’t sit still. Night after night its velocity toward or away from us came out different, and when they plotted the measurements against the date, they looked like noise.
But when they stacked the measurements up, cycle on top of cycle, each cycle four point two three days long, every point fell into line along one smooth wave. Something was tugging that star back and forth, and the best explanation was a planet, a giant of nearly half the mass of Jupiter, or more, circling so close to its star that its whole year lasts four days.
Nobody expected that, because in our own solar system a giant like Jupiter takes about twelve years to go round, and Mayor later called it a factor of a thousand out, so they waited a whole extra season, watching that star, before they told anyone. On the sixth of October, 1995, they announced it, the first planet anyone had ever found around a star like our Sun, and twenty-four years later it won them the Nobel Prize. Nobody has ever taken a picture of that planet, and all they ever had was that wave.
By the end of this lesson, you’ll be able to read that graph the way they did, and say when that star is coming at us fastest, when it stops coming closer and starts to pull away, where it is, and how far it swings. You’ll also see why a planet going round in a circle makes its star swing toward us and away in a perfect wave, a wave with a name you’ve met before, simple harmonic motion, so let’s start by writing it down.
The equation, read out loud
Here’s the simplest oscillator there is, a cart on a spring on a frictionless track, the one the AP exam uses again and again, with a number line underneath and zero right where the cart sits at rest, the equilibrium position. Pull the cart out to here and let it go, and it swings back and forth between the same two points, and we call its farthest distance from the middle the amplitude, A.
And here’s the equation that says where the cart is at every moment, x equals A times the cosine of two pi f t. x is the cart’s displacement from equilibrium, how far from the middle and on which side, A is the amplitude, f is the frequency, the number of cycles every second, which is one over the period, and t is the time.
Notice that we measure A from the middle, not from one end to the other, so from end to end the cart travels two A, and in one full cycle it travels four A. The piece inside the cosine, two pi f t, is an angle in radians, and it grows by two pi, one full turn, every period, so every period the cosine comes back to exactly where it started, and so does the cart.
At t equals zero the cosine is one, so the cart starts at A, at rest. A quarter of a period later it’s crossing the middle, at half a period it’s at negative A, and after a full period it’s back where it started.
Here’s a cart with an amplitude of twenty centimeters and a frequency of half a hertz, so each cycle takes two seconds. Where is it one second after we let it go?
Here’s why this matters. On the College Board’s own sample free-response question, students get a position graph like this one and have to sketch its velocity graph, and that sketch is worth three points. By the end of today you’ll earn all three.
Why a cosine? The shadow of a circle
So why a cosine? Let’s look at 51 Pegasi from above, a view nobody on Earth can get. The planet goes round in a big circle, and the star goes round too, in a tiny circle on the opposite side, because the two of them circle their common center of mass, and I’ve made the star’s circle two hundred times bigger so you can see it.
We’re fifty light-years away along this line, so we can’t see the star going round. All we can measure is the part of its motion that points toward us or away from us, which is exactly the motion of this shadow on the line. Look at what the shadow does. It slows down toward the ends, stops, turns around and speeds up again all the way back to the middle, which is simple harmonic motion, made by something going round a circle at a perfectly steady speed.
Let’s put the same idea next to our cart. Here’s a circle with a radius equal to the amplitude, with a dot going round it once every period, and the cart is the dot’s shadow at every moment. The dot turns two pi every lap, so in t seconds it turns two pi f t. On a circle of radius A, the shadow of a point at that angle sits at A times the cosine of the angle. That’s our equation.
It’s the unit circle from math class, stretched to radius A. On any circle, a point’s x is the radius times the cosine of its angle. The cart’s x is A times the cosine of two pi f t, the circle’s shadow, written down.
The circle tells us how fast the cart goes, too. In one period, the dot goes once around, a distance of two pi A. Its speed is two pi A over T, which is two pi f A. At the middle of the swing, the dot moves straight along the axis. The cart gets all of that speed, so its top speed is two pi f A.
Try it on the cart from the first check. Its amplitude is zero point two meters, and its frequency is half a hertz. How fast does it pass the middle? The dot’s acceleration always points at the center of the circle. At the ends of the swing, that’s straight along the axis, so the cart gets all of it.
Its size is v squared over the radius, A, so square two pi f A and divide by A. That leaves the cart’s top acceleration, two pi f, squared, times A. Neither formula is on the equation sheet. Draw the circle, and you can rebuild both.
Stopped, fastest, pulled hardest
Here’s the star at the instant it’s farthest from us, with its shadow at the far end of the line. At this exact moment, what’s the star’s velocity along our line of sight, and what’s its acceleration along it? Make a prediction before I turn the arrows on.
A quarter of a period later it crosses the middle, and everything swaps. Now its velocity points straight at us, so the shadow moves its fastest, and its acceleration points sideways, so the shadow’s acceleration is zero. So the shadow is stopped and pulled hardest at the ends, and fastest, with no acceleration at all, through the middle.
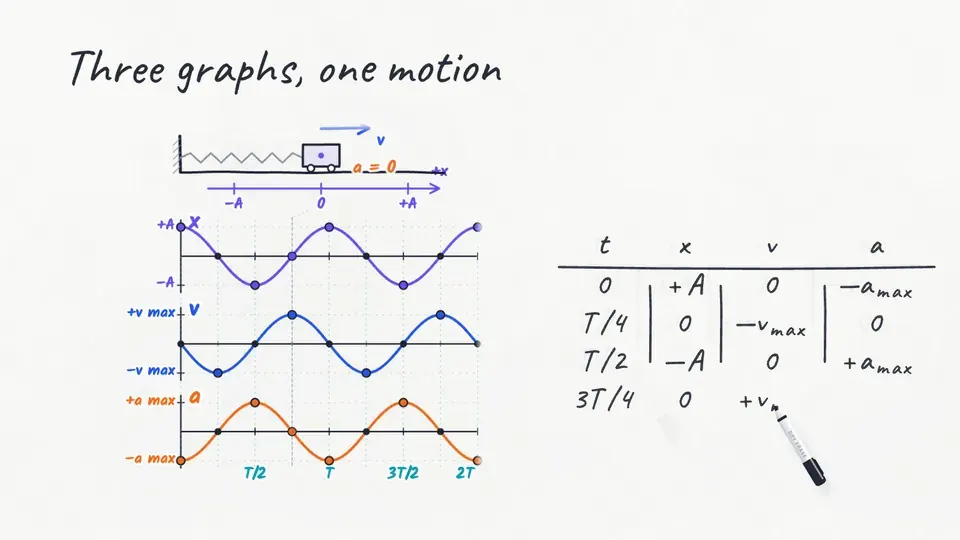
Let’s put all of this on graphs, starting with the position graph of the cart, the cosine. The velocity is the slope of the position graph. At the top the graph is flat for an instant, so the velocity is zero, and through the middle it’s at its steepest, going down, so the cart is moving its fastest there, the negative way, and its velocity is negative v max.
Plot those slopes and you get the velocity graph, which starts at zero, dips to negative v max, comes back through zero and climbs to positive v max, a sine wave turned upside down. A really common mistake is drawing the velocity graph with the same shape as the position graph, which would make the cart fastest exactly where it stops. The velocity graph runs a quarter of a period ahead, so its peaks sit where the position graph crosses zero.
Take the slope of the velocity graph and you get the acceleration, which is the position graph flipped upside down, because the acceleration always points back toward equilibrium and gets bigger the farther out the cart is. So whenever x is positive the acceleration is negative, and it’s biggest exactly where the cart is farthest away.
Here’s the whole story in one table. At t equals zero the cart’s at A, stopped, with the biggest acceleration, pointing negative. A quarter period later it’s at equilibrium, moving at negative v max, with no acceleration. At half a period it’s at negative A, stopped and pulled the positive way, and at three quarters it’s back at equilibrium, moving at positive v max.
Every quarter of a period, something hits zero and something else hits its biggest value, and if you can find those moments on any one of the graphs, you can sketch the other two. Here’s a moment marked on the position graph with the cursor. Which of these is true about the cart’s velocity and its acceleration at that instant?
Louder, not higher
Let’s take all of this somewhere you can hear it, an empty concert hall at night, and a tuning fork stamped A four forty, the international standard for the note A, four hundred forty hertz. Tap it, and each tine swings in and out four hundred and forty times a second, far too fast to see, so here it is through a high-speed camera, slowed down a thousand times, with an axis and arrows on the tip of one tine.
It’s the same motion as the cart and the star’s shadow, stopped and pulled hardest at the ends, fastest through the middle, and each full swing, there and back, takes one four-hundred-fortieth of a second, about two point two seven milliseconds. Now I’m going to strike it so the tine swings out twice as far. What happens to the time for one full swing, there and back?
Let’s strike two identical forks, one gently and one so its tine swings twice as far. Watch the tips arrive at the ends, together, and together again, every single swing. You can hear it, too, because the pitch of a note is its frequency. The harder one is louder, and it’s exactly the same note, the same four hundred forty hertz.
The bigger swing really does have twice as far to go, but it gets pulled twice as hard at every matching point, so it moves twice as fast the whole way, and twice the distance at twice the speed takes exactly the same time. So amplitude changes everything about the motion except how long each swing takes, and that’s why the spring’s period formula from last lesson, two pi times the square root of m over k, has no A in it anywhere.
Robert Hooke noticed this in 1678, when he wrote that the vibrations of a spring are of equal duration, whether they be greater or less, and it’s why a fork’s note never slides down as it fades. Now you take the mallet. Strike the fork so the tip of the tine passes through the middle at two meters per second. You’ll see the amplitude before you let go, but not the speed, so work it out first.
The fork shows one more thing really nicely. When the mallet hits it, the tine starts in the middle, already at top speed, so its position is A times the sine of two pi f t.
The tine is still ringing from that strike. Drag the start of the clock along its trace to the moment that would make its equation a cosine.
And that’s exactly what a pinch does, because it lets the tine go from the end, at rest, so after a pinch its position is A times the cosine. It’s the same note and the same motion, and the only difference is the moment we started the clock, so before you pick sine or cosine, ask where the object is at t equals zero. Whack it hard enough to make it buzz, though, and the steel stops acting like a simple spring, you hear extra notes come in, and the motion still repeats but isn’t simple harmonic anymore.
The tine (I do)
Let’s put real numbers on that tine, the way you would on the exam, starting with a sketch of the tine tip, its equilibrium position and a positive direction. The frequency is four hundred forty hertz, and for an ordinary strike, say the amplitude is half a millimeter, five times ten to the minus four meters. We want the top speed and the top acceleration, and where each one happens.
The top speed is two pi f A, two pi times four forty times five times ten to the minus four, about one point four meters per second, as the tine passes the middle. The top acceleration is two pi f, squared, times A, about thirty-eight hundred meters per second squared, at the two ends.
That’s about three hundred and ninety g, nearly four hundred times the acceleration of gravity, from a fork you tapped on your knee. And it makes sense, because the tine has to stop and turn around eight hundred and eighty times every second. Hertz times meters is meters per second, and hertz squared times meters is meters per second squared, so the units work. Strike it so the amplitude doubles, and the top speed and the top acceleration double too, while the period doesn’t change at all.
Two swings, one clock (we do)
Here’s the same idea in a real measurement. In a well-known lecture demonstration at MIT, they timed ten full swings of a cart on a spring, fifteen point one six seconds when they pulled it out twenty centimeters, and fifteen point one three when they pulled it out forty.
They doubled the amplitude, and ten swings took the same time to within three hundredths of a second, which is about as well as anyone can work a stopwatch, so dividing by ten, the period is about one point five one seconds either way. Here are both swings on one position graph. Different heights, but they cross zero at the same moments, and that’s what the same period looks like on a graph.
So if an exam asks you to justify that the period doesn’t depend on amplitude, this data is your evidence, because doubling the amplitude changed the time for ten swings by just three hundredths of a second. Now let’s work one together. What’s the top speed of the cart they pulled out forty centimeters? Give it in meters per second.
Read the star (you do)
Now you’re ready for the real thing. These are eight hundred and sixty-four real measurements of 51 Pegasi’s velocity, from four different instruments over twenty-five years, and when we plot them against the date, they’re a mess. The astronomers’ trick is to chop the twenty-five years into slices, each one period long, and stack the slices on top of each other, so with the wrong period every slice lands out of step and you get a cloud, and only at exactly the right period does every cycle land on the same wave.
Find the planet yourself. Turn the period dial until all of the dots fall onto one wave. The strip under the dial shows where they line up best, so start near the tallest spike and go slowly.
The wave rises to about fifty-six meters per second away from us and falls to fifty-six toward us, and it repeats every four point two three days. Because that period is known to within seconds, you can work out where the star was on any date. On the morning the Nobel Prize was announced, its velocity sat at the very bottom of this graph, so drag the star round its circle to where it must have been. There it is, rushing toward us at almost exactly its top speed, and the same arithmetic works for any date you like, your birthday included.
Let’s read it the way the astronomers did. Where the velocity is zero, the star isn’t moving toward us or away from us at all, because it’s moving sideways, so it’s at one end of its swing, as far from us or as near as it gets, and where the velocity peaks, it’s crossing the middle. The peak is the star’s top speed along our line of sight, about fifty-six meters per second, and the top speed is two pi f A, so A is v max over two pi f, which is v max times the period, over two pi.
So here’s the promise. Using the top speed from the graph, fifty-five point nine meters per second, and the period, four point two three days, how far does 51 Pegasi swing toward us and away from us, measured from the middle? Give your answer in kilometers.
That’s about half the radius of the Earth, for a star a hundred and thirty times wider than the Earth, swinging toward us and away at up to a hundred and twenty-five miles an hour, twice as fast as a car on the highway, and astronomers measured it from fifty light-years away just by watching its light. In 1995 they measured that top speed as fifty-nine meters per second, and today it’s fifty-six, because twenty-five more years of better measurements have pinned it down.
Sketch it, then justify it
Here’s that College Board sample question, in our own words. You pull a block on a horizontal spring to negative x zero and let it go from rest, and the question gives you its position graph, which has a period of two t zero. You can crack any of these by asking where the velocity starts, which way the block moves first, and where the position graph is steepest, because that’s where the speed peaks.
Now you sketch it. I’ve copied the position graph’s shape onto the velocity axes, which is exactly the mistake the readers see, so drag the five dots until the velocity graph tells the truth about this block.
Those are exactly the three things the readers score, the same period as the position graph, the same height above and below zero, and the shape of a positive sine. That’s all three points.
The next part shows a free-body diagram with a normal force, gravity, and a spring force, and a student claims it shows the block at one and a half t zero. Is that consistent with your velocity graph?
Find one and a half t zero on the velocity graph. The graph is at its lowest point there, with the block passing equilibrium at top speed, moving left, and at a lowest point the slope is zero.
The slope of the velocity graph is the acceleration, so the acceleration is zero there, which means the net force on the block is zero, and since the question asks about your velocity graph, that zero slope is the reason to give. But that diagram has a spring force with nothing to balance it, so the student’s claim doesn’t fit the graph. Which of these justifications earns both points?
The answer built on the zero slope earns both points, one for saying clearly that the diagram doesn’t fit your graph, and one for showing that the net force has to be zero, using a feature of the velocity graph, and that’s exactly the sentence that earns them. And the readers score this part against your own sketch, so even if your velocity graph was wrong, a correct argument from it still earns both points.
The shadow of a circle
So here’s what to take away. x equals A cos two pi f t is the shadow of something going round a circle, and the circle hands you the top speed, two pi f A, and the top acceleration, two pi f, all squared, times A. At the ends it’s stopped and pulled hardest, and in the middle it’s fastest with no acceleration at all, and each graph runs a quarter of a period ahead of the one before it, with velocity the slope of position, and acceleration the position graph upside down. And amplitude changes the size of everything, the swing, the speed and the pull, but never the period.
And that’s how two astronomers found a world nobody has ever photographed, by reading the velocity graph of a star that its planet swings around in a circle, fifty light-years away. Here’s something to think about before next time. The star itself never slows down, because it’s going round its circle at a steady speed, and only its shadow stops at the ends. But the tip of that tuning fork really does stop dead at the ends and fly through the middle, so where does all that speed go, and where does it come back from? That’s the next lesson.