
The answers at a glance
| Part | Answer | Students who earned it |
|---|---|---|
| Question 1 | Function Concepts | mean 2.95 of 6 |
| A(i) | 63% | |
| A(ii) | , , | 61% |
| B(i) | 51% | |
| B(ii) | 48% | |
| C(i) | does not have an inverse function | 59% |
| C(ii) | : one output, three inputs | 15% |
| Question 2 | Modeling a Non-Periodic Context: video game sales | mean 2.03 of 6 |
| A(i) | and | 58% |
| A(ii) | , | 36% |
| B(i) | 0.396 thousand units per day | 58% |
| B(ii) | 59.780 thousand units | 39% |
| B(iii) | is concave down, so the secant line lies below its graph | 4% |
| C | After day 91 sales fall but keeps rising, so the gap grows | 8% |
| Question 3 | Modeling a Periodic Context: the rolling tire | mean 2.96 of 6 |
| A, heights | F 18, G 9, J 0, K 9, P 18 | 71% |
| A, times | , , , , | 39% |
| B, and | , | 60% |
| B, and | , | 20% |
| C(i) | a: positive and increasing | 68% |
| C(ii) | The rate of change of is decreasing (the graph is concave down) | 38% |
| Question 4 | Symbolic Manipulations | mean 1.28 of 6 |
| A(i) | 37% | |
| A(ii) | 33% | |
| B(i) | 16% | |
| B(ii) | 24% | |
| C, first point | One solution, such as | 15% |
| C, second point | for any integer | 4% |
Question 1: Function Concepts
Graphing calculator required. Question 1 is on page 3 of the PDF.
A (i) , so .
A (ii) , and
B (i) when .
B (ii)
C (i) does not have an inverse function.
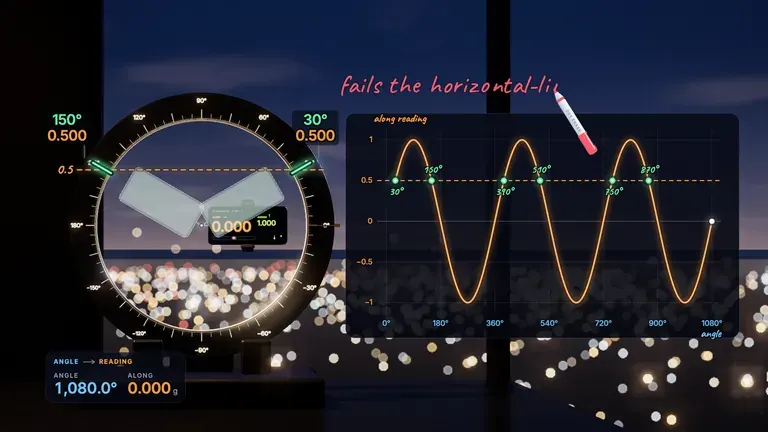
C (ii) , so the output 1 comes from three different inputs. An inverse would have to send 1 to three different values, and a function gives each input exactly one output, so the inverse of can’t be a function.
Why it works
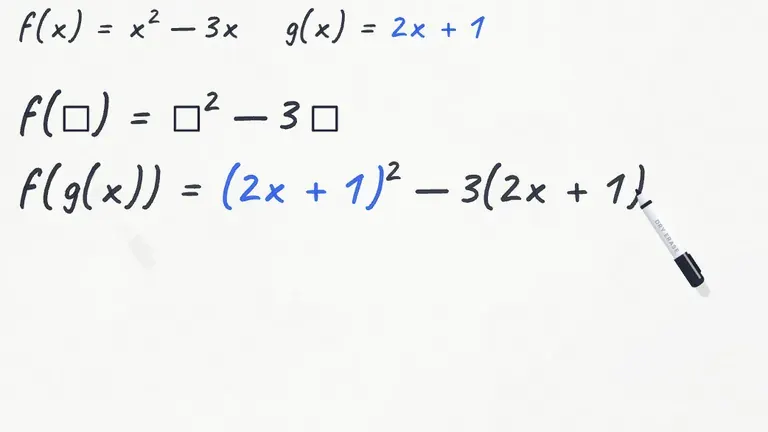
- Composition works from the inside out: read the inner output on the graph before evaluating the exponential.
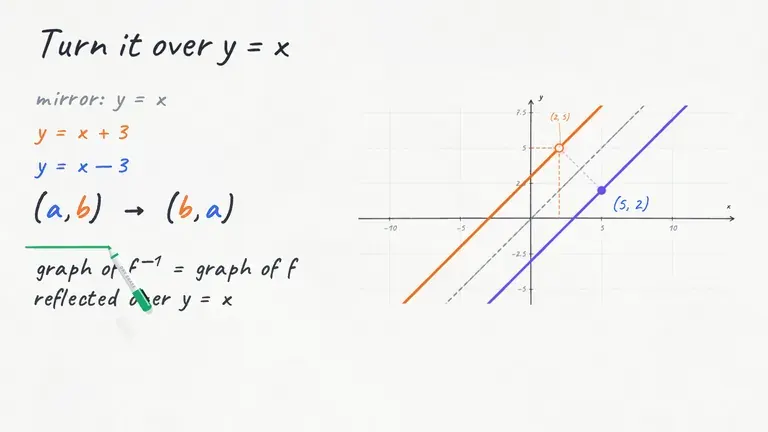
- The horizontal line at height 1 meets the graph three times. Reversing those pairs would give one input three outputs, so the inverse relation is not a function.
- Keep the logarithm quotient as one calculator expression; rounding its numerator first can change the final decimal.
On the calculator. For B(i), graph and and find the intersection: tap it in Desmos, or use 2nd, TRACE (CALC), 5: intersect on a TI-84. By hand, , typed as one expression so nothing is rounded along the way.

Question 2: Modeling a Non-Periodic Context
Graphing calculator required. Question 2 is on page 4 of the PDF.
A (i) and , so and .
A (ii) , so . Then .
B (i) thousand units per day
B (ii) thousand units
B (iii) is the -coordinate of a point on the secant line through and . Since , the graph of is concave down on , so the secant line lies below the graph of there. So for .
C On day 91 the model and the real sales agree: both are 76 thousand. After day 91 real daily sales decrease, but keeps increasing, so the difference between them gets larger every day.
Why it works
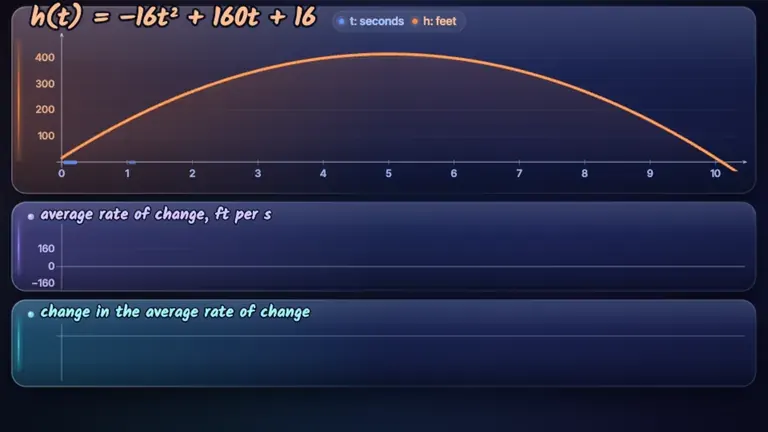
- The linear estimate and the logarithmic prediction are different objects. The estimate follows the secant line between the two measured days.
- Use without rounding in the estimate. Starting at either endpoint produces the same line.
- After day 91, the measured daily sales fall while the fitted model rises. Their agreement at day 91 explains why the gap then grows.
On the calculator. Compute and store it, then store the rate before using it in B(ii). That’s the habit the report asks for by name: keep values in the calculator so the third decimal survives.
Question 3: Modeling a Periodic Context
No calculator. Question 3 is on pages 7–8 of the PDF.
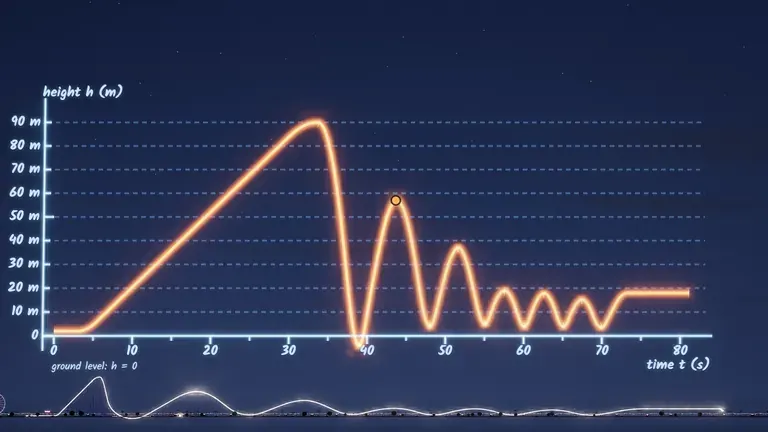
A W touches the ground at and , so the period is 2 seconds and the labeled points are second apart. Heights run from 0 to 18, so the midline is 9. W is at the top halfway between the two ground contacts, at , so that’s F. F , G , J , K , P .
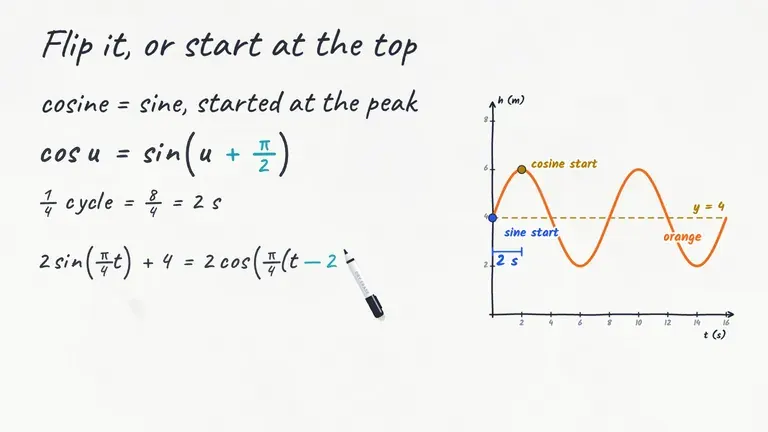
B , , . The first peak is at , so . That gives . Check: , and .
C (i) a: is positive and increasing.
C (ii) The graph of is concave down on , so the rate of change of is decreasing.
Why it works
- The height of the hub gives the midline; the radius gives the amplitude. Ground contacts fix the period.
- A maximum occurs a quarter period after an upward midline crossing. That is why works in this sine form.
- Between K and P the height rises while its slope falls toward zero. Positive height and positive slope are separate facts.
Positive doesn’t mean above the midline. Here the midline is at 9, and the height between K and P is above it, but the answer is “positive” because , which is true for the tire everywhere except the moments W touches the ground.
Question 4: Symbolic Manipulations
No calculator. Question 4 is on page 9 of the PDF.
A (i) , so and .
A (ii) , so and .
B (i)
B (ii) , so
C means . So and , where is any integer.
Why it works
- Undo the outer inverse function before solving the tangent equation.
- The factor of 2 inside the tangent also divides the spacing between solutions: the spacing in is .
- The logarithm rewrite keeps . The trigonometric rewrite keeps both and from the original expression.
The pattern behind 1.28 out of 6. This was the lowest-scoring question of 2024, and the report put it plainly: across the exam, students did better with concepts than with algebraic manipulation. Every part here is a standard move, and the FRQ guide lists them with the trap for each.
From points to a score
Mark your work with the official 2024 scoring guidelines, including their partial-credit and decimal-presentation rules. Record each question’s score below, then enter those scores in the score calculator. The calculator uses the May 2027 multiple-choice format, so do not enter a 40-question 2024 multiple-choice total as though it were out of 42.
Record your 2024 free-response scores
How each question type is scored, and how to write the explanations that so few students earned, is in the AP Precalculus FRQ guide. More practice: the 2026 solutions and the 2025 solutions.
Sources
- 2024 AP Precalculus Free-Response Questions (PDF)
- 2024 AP Precalculus Scoring Guidelines (PDF)
- 2024 AP Precalculus Chief Reader Report: per-point means and common errors (PDF)
- 2024 AP Precalculus Scoring Statistics (PDF)
- AP Precalculus score distributions (AP Students)
- AP Precalculus past exam questions, 2024–2026 (AP Central)
- Texas Instruments: finding intersections on TI-83/84 calculators
- Texas Instruments: TI-84 Plus CE best practices (PDF), CALC menu and zero/intersection tools