
The answers at a glance
| Part | Answer | Students who earned it |
|---|---|---|
| Question 1 | Function Concepts | mean 3.51 of 6 |
| A(i) | 64% | |
| A(ii) | 72% | |
| B(i) | , , | 56% |
| B(ii) | 56% | |
| C(i) | Exponential | 73% |
| C(ii) | Over input steps of 1, each output is 0.5 times the one before | 30% |
| Question 2 | Modeling a Non-Periodic Context: song plays | mean 2.16 of 6 |
| A(i) | , , | 53% |
| A(ii) | , , | 48% |
| B(i) | 2.25 thousand plays per month | 63% |
| B(ii) | 28.375 thousand plays | 41% |
| B(iii) | is concave down, so the secant line lies below its graph | 6% |
| C | Total plays never decrease, but decreases after its maximum at , so the domain ends at | 5% |
| Question 3 | Modeling a Periodic Context: the guitar string | mean 3.13 of 6 |
| A, heights | F 2, G 0, J −2, K 0, P 2 | 77% |
| A, times | , , , , | 34% |
| B, and | , | 67% |
| B, and | , | 18% |
| C(i) | d: negative and decreasing | 67% |
| C(ii) | Concave up; the rate of change of is increasing | 51% |
| Question 4 | Symbolic Manipulations | mean 1.93 of 6 |
| A(i) | 53% | |
| A(ii) | 43% | |
| B(i) | 45% | |
| B(ii) | 28% | |
| C, first point | 14% | |
| C, second point | 10% |
Question 1: Function Concepts
Graphing calculator required. Question 1 is on page 3 of the PDF.
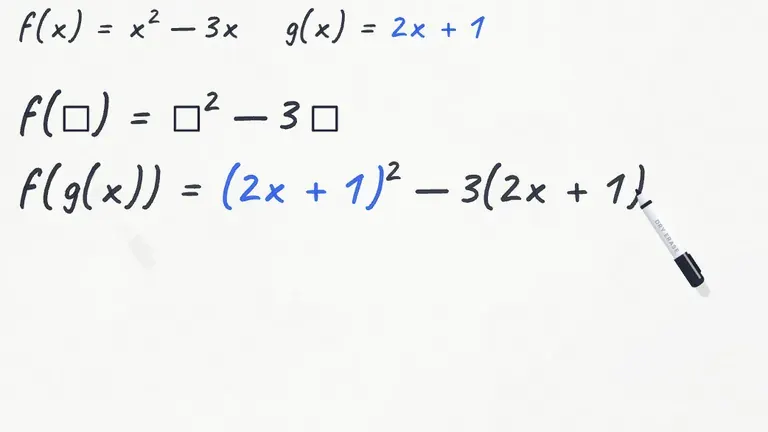
A (i) , so .
A (ii) , so .
B (i) , and
B (ii)
C (i) Exponential.
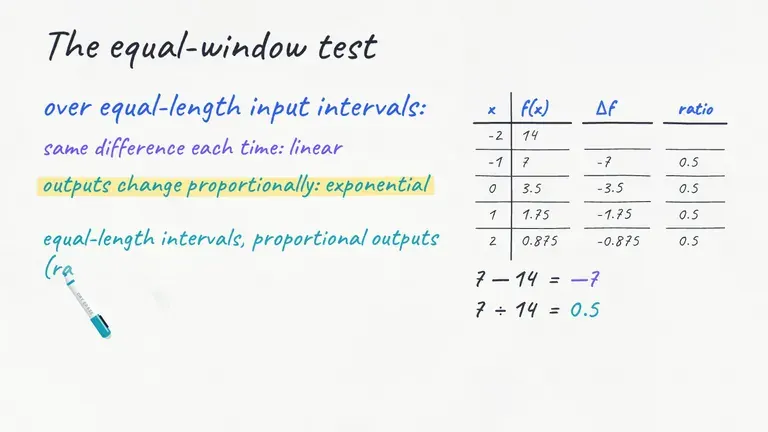
C (ii) The inputs in the table go up by 1 each step, and each output is 0.5 times the one before: . Over equal-length input intervals the outputs change by the same factor, so is best modeled by an exponential function.
Why it works
- The composition uses 1.75 as the input to the cubic; it does not use 1 again.
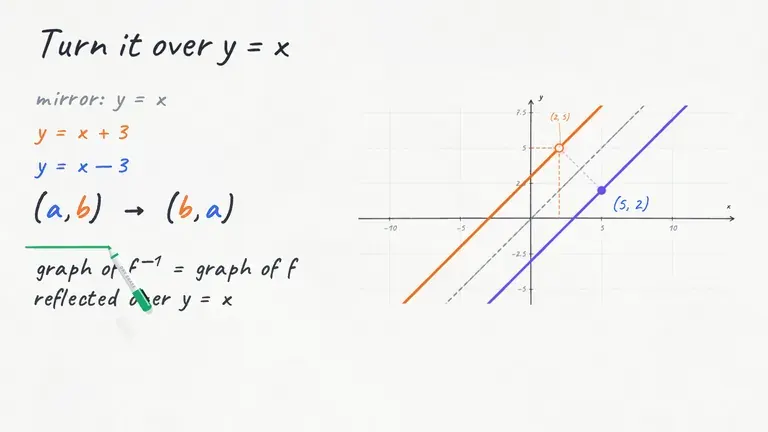
- An inverse lookup runs backward through the input-output pairs.
- A graphing window must include the zero near 5.6 as well as the other two. The table’s repeated ratio explains the exponential model independently of any regression.
On the calculator. For A(i), store 1.75 or type it in directly. For B(i), graph and find each -intercept: tap them in Desmos, or use 2nd, TRACE (CALC), 2: zero on a TI-84, once per zero. Make sure the window shows all three: the third is near , and the report lists missing solutions as a common error.

Question 2: Modeling a Non-Periodic Context
Graphing calculator required. Question 2 is on page 4 of the PDF.
A (i) , and give , and .
A (ii) With : and . Doubling the first and subtracting it from the second gives , so , then and .
B (i) thousand plays per month
B (ii) thousand plays
B (iii) is the -coordinate of a point on the secant line through and . Since , the graph of is concave down on , so the secant line lies below the graph of there. So for .
C The total number of plays since release can never decrease. has its absolute maximum at and decreases after that, so can only model the total plays up to : the right end of its domain is .
Why it works
- Subtracting twice the first reduced equation from the second isolates ; substituting back gives .
- The secant line joins the interval’s endpoints. The middle measurement is above that line, so starting the estimate there changes the model.
- A cumulative play count cannot decrease. That contextual fact is what makes the quadratic’s maximum a useful boundary.
On the calculator. For A(ii), put the three points in a table and run a quadratic regression ( in Desmos, or QuadReg on a TI-84). Three points with distinct inputs fit a polynomial of degree at most two; these three give a quadratic. You still need the three equations on paper for A(i): the regression output doesn’t earn that point.
Why B(iii) and C went to so few students. They need no new math. B(iii) needs concavity and the secant line in the same sentence; C needs what the model does and what the real total can do, side by side. The FRQ guide has examples of answers that do and don’t earn these points.
Question 3: Modeling a Periodic Context
No calculator. Question 3 is on page 6 of the PDF.
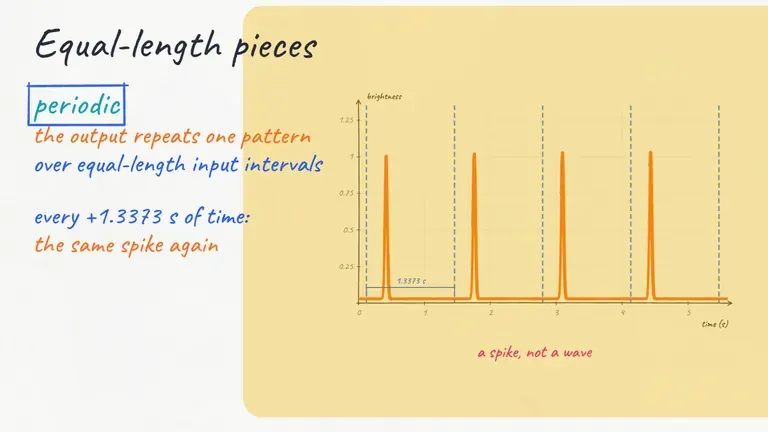
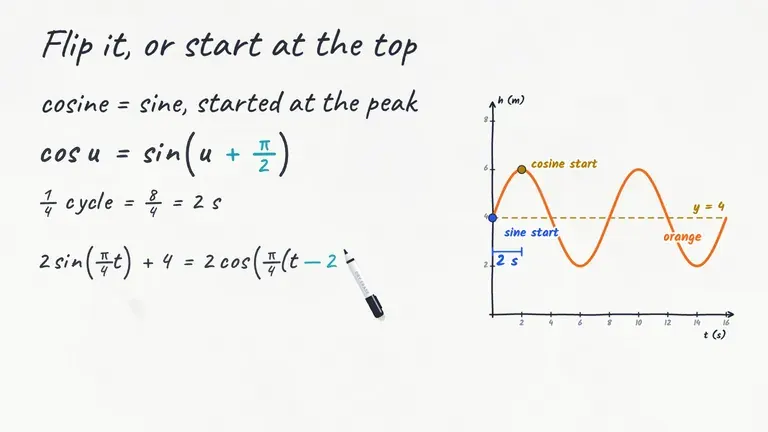
A 200 cycles a second means one cycle takes second, so the labeled points are second apart. X starts at its highest point, so F is at . F , G , J , K , P .
B , , . The first peak is at , so . That gives . Check: .
C (i) d: is negative and decreasing.
C (ii) The graph of is concave up on , and the rate of change of is increasing.
Why it works
- Frequency counts cycles per second; period measures seconds per cycle. Divide the period by four to space the five marked times.
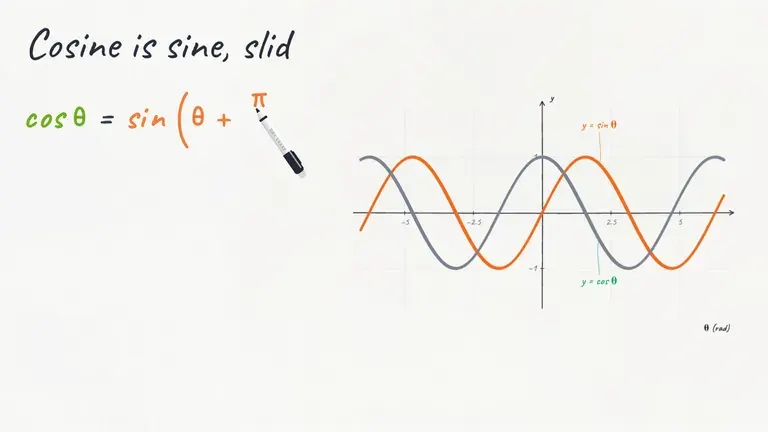
- In , has units of time. The angle shift in is , not .
- From G to J, decreases toward its minimum while its slope increases toward zero. “The rate of change of is increasing” avoids ambiguity.
**The trap.** Because sits inside , it’s measured in seconds, and here it’s tiny: . A value like belongs to the other form, . The cosine model is also true but isn’t the form asked for; the guidelines gave it 1 of the 2 points in part B.
Question 4: Symbolic Manipulations
No calculator. Question 4 is on page 7 of the PDF.
A (i) , so and .
A (ii) , so and . In , cosine is positive, so .
B (i) , so .
B (ii) , so .
C . is impossible because , so and .
Why it works
- Only the first-quadrant cosine solution lies in the requested interval.
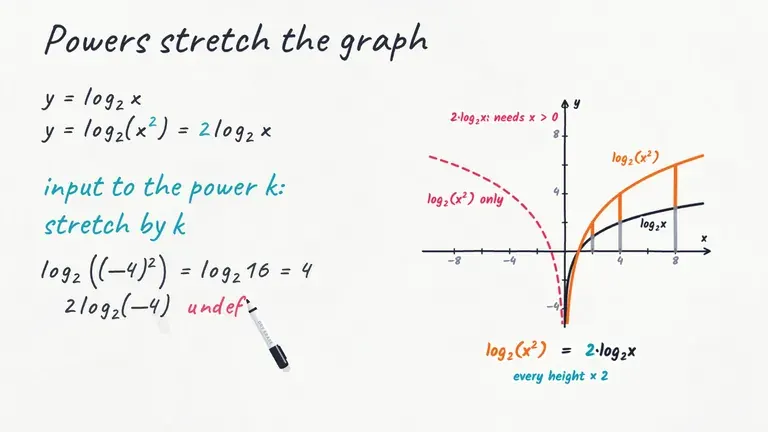
- Use as one variable before factoring; the negative root for that variable cannot produce a real .
- The logarithms require . The tangent rewrite retains and from the original expression.
Why part C stopped so many students. is , and once you see that, the equation is an ordinary quadratic. The Chief Reader’s note was that few responses recognized it. If an equation has and , or and , try the substitution first.
From points to a score
Mark your work with the official 2025 scoring guidelines, including their partial-credit and decimal-presentation rules. Record each question’s score below, then enter those scores in the score calculator. The calculator uses the May 2027 multiple-choice format, so do not enter a 40-question 2025 multiple-choice total as though it were out of 42.
Record your 2025 free-response scores
How each question type is scored, and how to write the explanations that so few students earned, is in the AP Precalculus FRQ guide. More practice: the 2026 solutions and the 2024 solutions.
Sources
- 2025 AP Precalculus Free-Response Questions (PDF)
- 2025 AP Precalculus Scoring Guidelines (PDF)
- 2025 AP Precalculus Chief Reader Report: per-point means and common errors (PDF)
- 2025 AP Precalculus Scoring Statistics (PDF)
- AP Precalculus score distributions (AP Students)
- AP Precalculus past exam questions, 2024–2026 (AP Central)
- Texas Instruments: finding intersections on TI-83/84 calculators
- Texas Instruments: TI-84 Plus CE best practices (PDF), CALC menu and zero/intersection tools