
The answers at a glance
| Part | Answer |
|---|---|
| Question 1 | Function Concepts |
| A(i) | |
| A(ii) | |
| B(i) | |
| B(ii) | |
| C(i) | Yes, is invertible |
| C(ii) | is increasing, so no output value repeats |
| Question 2 | Modeling a Non-Periodic Context: the car’s value |
| A(i) | and |
| A(ii) | , |
| B(i) | thousand dollars per year |
| B(ii) | thousand dollars |
| B(iii) | is concave up, so the secant line lies above its graph |
| C | The model only applies until , at years |
| Question 3 | Modeling a Periodic Context: the waterwheel |
| A | F , G , J , K , P |
| B | , , , |
| C(i) | c: negative and increasing |
| C(ii) | Concave up; the rate of change of is increasing |
| Question 4 | Symbolic Manipulations |
| A(i) | |
| A(ii) | |
| B(i) | |
| B(ii) | |
| C | , , |
Question 1: Function Concepts
Graphing calculator required. Question 1 is on page 3 of the PDF.
A (i) From the graph, . So .
A (ii)
B (i) when .
B (ii)
C (i) Yes, is invertible.
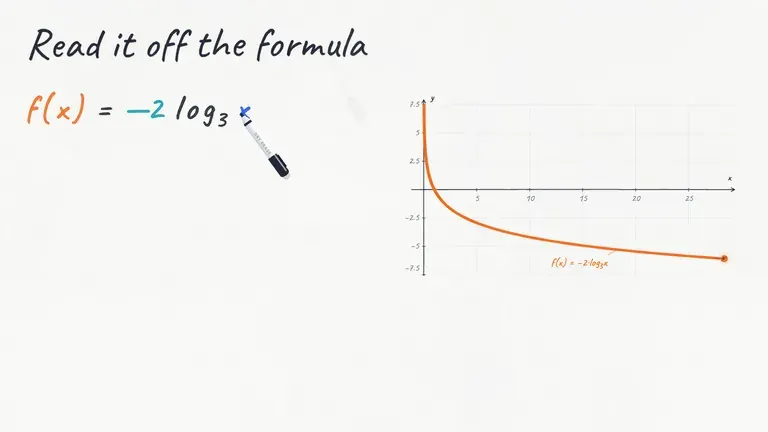
C (ii) is increasing on its whole domain, so no two points on its graph have the same -coordinate. The marked points have outputs , , , , and , all different. Each output of comes from exactly one input, so has an inverse function.
Why it works
- The logarithm exists only for . Its approach to the vertical asymptote is therefore from the right.
- Strict increase across the whole domain establishes invertibility. Distinct values at a few marked points alone would not prove it.
- Solving the logarithmic equation algebraically gives a useful independent check on the graph intersection.
On the calculator. For A(i), enter , or define and evaluate . For B(i), graph and and find the intersection: tap it in Desmos, or use 2nd, TRACE (CALC), 5: intersect on a TI-84. You can also solve it by hand: , so .
Where students lose points. The College Board hasn’t published the 2026 Chief Reader report, so there are no per-point averages yet. On 2024’s and 2025’s question 1, the limit was missed by about half of students and the reason in C(ii) by 70% to 85%. The 2026 limit added a twist: a one-sided limit at an asymptote instead of end behavior.
Question 2: Modeling a Non-Periodic Context
Graphing calculator required. Question 2 is on page 4 of the PDF.
A (i) and , so and .
A (ii) Dividing, , so (0.885398…) and (30.720646…).
B (i) thousand dollars per year
B (ii) thousand dollars
B (iii) is the -coordinate of a point on the secant line through and . Because and , the graph of is concave up everywhere, so on the secant line lies above the graph of . So for .
C is positive and decreasing for . It reaches 2 at the time where , which is years. At that moment the car is donated and is worth nothing, which the model doesn’t show, so only applies on the domain .
Why it works
- The first measurement is at year 1, so it equals , not . Divide the two data equations before finding the initial value.
- The average rate gives a secant-line estimate. Concave-up exponential decay lies below that line between the measurements.
- Use the stored constants when solving . The threshold time is about 22.444 years; rounding the constants first changes it noticeably.
On the calculator. For A(ii), compute and store it, then . An exponential regression on the two points also works and fits them exactly: in Desmos, or ExpReg on a TI-84. For C, graph with the stored values and , and find the intersection.
Rounding changes the answer. With and rounded to 30.721 and 0.885 before solving, part C comes out 22.361 instead of 22.444. The guidelines accepted any value from 22.36 to 22.444 here, but drift like that can cost a point elsewhere. Store the unrounded values.
Where students lose points. No 2026 report yet. On 2024’s and 2025’s question 2, the secant-line explanation in B(iii) went to 4% and 6% of students, and part C to 8% and 5%. In 2026 the direction flipped: is concave up, so the estimates are too high, not too low. A student who had memorized “the secant line is below the graph” from earlier years would have written the wrong reason.


Question 3: Modeling a Periodic Context
No calculator. Question 3 is on pages 6–7 of the PDF.
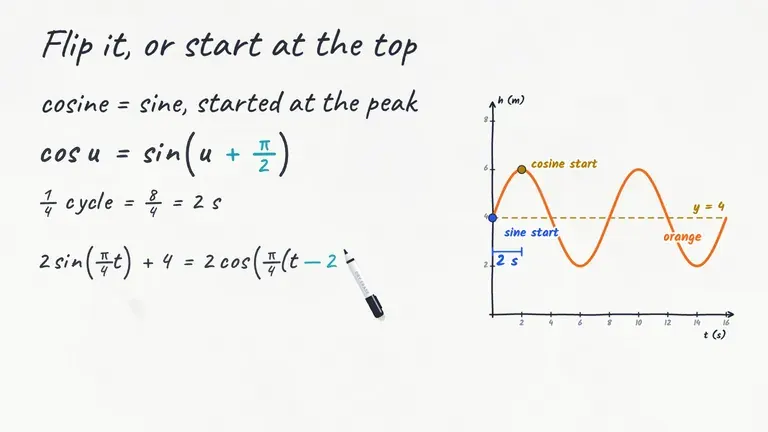
A The radius is 6, so runs from 6 down to −6 around a midline at 0. One revolution takes 10 seconds, so the labeled points are 2.5 seconds apart. W starts at the top, so F is at . F , G , J , K , P .
B , , . The first peak is at , so . That gives . Check: .
C (i) c: is negative and increasing.
C (ii) The graph of is concave up on , so the rate of change of is increasing.
Why it works
- The center line is height zero in this model; it is not the ground. That is why the minimum height is negative.
- A quarter of the 10-second period is 2.5 seconds. Starting sine a quarter cycle ahead puts the maximum at time zero.
- From J to K the point is below the center and rising, with an increasing slope. Turning clockwise instead would give the same height history from this starting point.
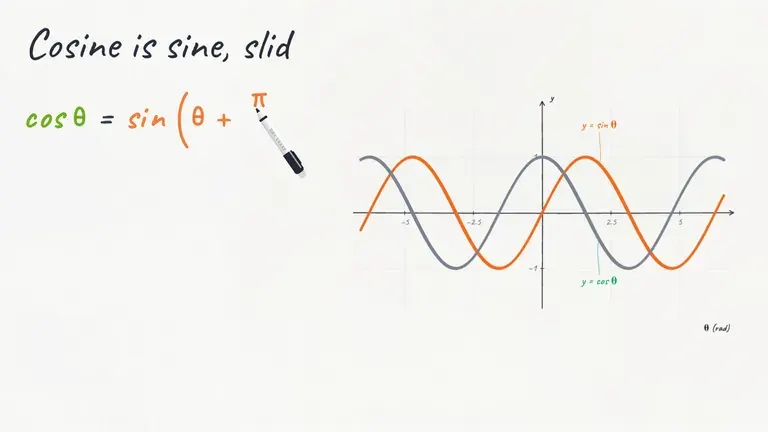
The cosine trap. The natural model here is , and it’s correct, but it isn’t the form the question asks for. The guidelines gave a cosine answer with the right values 1 of the 2 points in part B. Answer in the form you’re given.
Where students lose points. On 2024’s and 2025’s question 3, the times in part A went to 39% and 34% of students, and and in part B to 20% and 18%. The FRQ guide has a short method for that works every time.
Question 4: Symbolic Manipulations
No calculator. Question 4 is on page 8 of the PDF.
A (i) , so and .
A (ii) , so and .
B (i)
B (ii)
C , so or . Then or , so or . In : , and .
Why it works
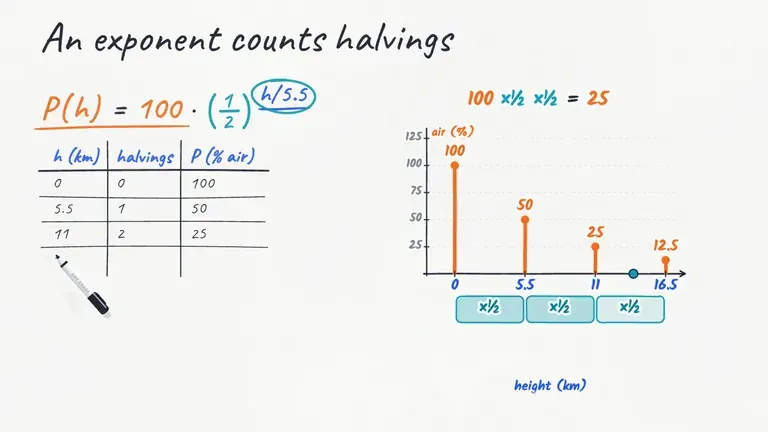
- A reciprocal power of has a negative exponent. Compare the exponents only after writing both sides with the same base.
- The sine rewrite retains from the original secant factor.
- Taking a square root creates two tangent equations. Solve both for the inside angle, divide by 3, then keep only values in the requested interval.
Where students lose points. Question 4 had the lowest average of the four questions in both years with published data, 1.28 of 6 in 2024 and 1.93 in 2025, and its last point went to 4% and then 10% of students. In 2026 the trap was the square: has two cases, and one of the three answers comes from the negative one.
From points to a score
Mark your work with the official 2026 scoring guidelines, including their partial-credit and decimal-presentation rules. Record each question’s score below, then enter those scores in the score calculator. The calculator uses the May 2027 multiple-choice format, so do not enter a 40-question 2026 multiple-choice total as though it were out of 42.
Record your 2026 free-response scores
How each question type is scored, and the habits that earn the hard points, are in the AP Precalculus FRQ guide. More practice: the 2025 solutions and the 2024 solutions.
Sources
- 2026 AP Precalculus Free-Response Questions (PDF)
- 2026 AP Precalculus Scoring Guidelines (PDF)
- 2025 AP Precalculus Chief Reader Report (PDF)
- 2025 AP Precalculus Scoring Statistics (PDF)
- 2024 AP Precalculus Chief Reader Report (PDF)
- 2024 AP Precalculus Scoring Statistics (PDF)
- AP Precalculus past exam questions, 2024–2026 (AP Central)
- Texas Instruments: finding intersections on TI-83/84 calculators
- Texas Instruments: TI-84 Plus CE best practices (PDF), CALC menu and zero/intersection tools