
Estimate your score
Use scores from a full practice exam taken under real timing, or from released free-response questions marked with the College Board’s own scoring guidelines. Enter 2027-format multiple-choice scores (29 and 13), not totals from the older 40-question exam. Fill every active box; the calculator treats a blank as zero. Count only what you got right: the exam takes nothing off for a wrong answer.
Estimate your AP Precalculus score
| AP score | Best estimate | Estimated range |
|---|---|---|
| 5 | 71 | 67–75 |
| 4 | 56 | 51–59 |
| 3 | 38 | 33–42 |
| 2 | 28 | 24–33 |
To do it by hand, calculate 43.75 × Part A ÷ 29, 18.75 × Part B ÷ 13 and 37.5 × free-response points ÷ 24. Add the three without rounding along the way, then round the total to the nearest whole number. This is how our model classifies each composite.
| Composite (out of 100) | Estimated AP score |
|---|---|
| 75–100 | A 5 |
| 67–74 | A 4 or a 5 (from 71 up, our central estimate gives a 5) |
| 59–66 | A 4 |
| 51–58 | A 3 or a 4 (from 56 up, our central estimate gives a 4) |
| 42–50 | A 3 |
| 33–41 | A 2 or a 3 (from 38 up, our central estimate gives a 3) |
| 24–32 | A 1 or a 2 (from 28 up, our central estimate gives a 2) |
| 0–23 | A 1 |
How the composite is built
The exam has four timed parts, and the College Board publishes the share of your score that each one carries. Our calculator divides that share equally among the questions or points in each part.
| Part | Questions | Time | Calculator | Share of your score | Each question or point is worth |
|---|---|---|---|---|---|
| Multiple choice, Part A | 29 | 65 min | Not allowed | 43.75% | 1.51 |
| Multiple choice, Part B | 13 | 40 min | Graphing calculator required | 18.75% | 1.44 |
| Free response, Part A: questions 1 and 2 | 2 (12 points) | 35 min | Graphing calculator required | 18.75% | 1.56 |
| Free response, Part B: questions 3 and 4 | 2 (12 points) | 35 min | Not allowed | 18.75% | 1.56 |
Here and are the questions you got right in the two multiple-choice parts, and is your free-response total out of 24.
A free-response point is worth a little more than a multiple-choice question: 1.56, against 1.51 for a Part A question and 1.44 for Part B. So the fifth point on a question you’ve mostly solved counts as much as a whole question in Section I. Part A is also the biggest block on the exam. Its 29 no-calculator questions carry 43.75% of your score, more than all four free-response questions put together.
You get one point for each correct multiple-choice answer and nothing for a blank or a wrong one, so guess on every question you can’t finish.
Say a timed practice exam goes like this: 22 of 29 in Part A, 10 of 13 in Part B, and 5, 3, 4 and 2 on the four free-response questions, a total of 14 out of 24.
How it scores
| Multiple choice, Part A | 22/29 | 22 × 43.75 ÷ 29 = 33.19 composite points |
|---|---|---|
| Multiple choice, Part B | 10/13 | 10 × 18.75 ÷ 13 = 14.42 composite points |
| Free response | 14/24 | 14 × 37.5 ÷ 24 = 21.88 composite points |
Why it works
- Using unrounded contributions gives 69.487732…; the composite rounds to 69.
- That is inside our estimated range for the 5 line (67 to 75) and below our central estimate of 71, so the model reports a 4 or a 5 and leans toward a 4.
- The 2 out of 6 on question 4 leaves the most room. In 2025, only 14% of students earned the first point in its last part and 10% the second. Three more points on that question add 4.7 and make the composite 74; four more make it 76, above the whole range.
Where the lines for a 3, 4 and 5 fall
The College Board doesn’t say. It publishes no composite cutoffs for AP Precalculus, for any year, so every cutoff you see online is an estimate, ours included.
The lines come from evidence about college students. Since 2022 the College Board has used a method it calls evidence-based standard setting. Hundreds of college professors compare the exam’s questions with their own final exams. In some subjects, professors also give the AP exam to their own students, and researchers track how AP students do in the next course they take. The College Board then sets each line at the point where students show the knowledge and skills expected for that score.
The College Board keeps that standard the same from year to year, but the raw line can move. It converts composites to scores with statistical processes “designed to ensure that, for example, a 3 this year reflects the same level of achievement as a 3 last year.” If one year’s questions are harder, the same standard takes fewer points.
| Score | Middle 80% of model scenarios | Our best single guess | The line most calculators use |
|---|---|---|---|
| 5 | 67 and 75 | 71 | 67 |
| 4 | 51 and 59 | 56 | 54 |
| 3 | 33 and 42 | 38 | 42 |
| 2 | 24 and 33 | 28 | 31 |
We give a range because a single number would claim more than the published data can support. If your composite is 69, the honest answer is “a 4 or a 5.” A 77 gives a 5 in almost every version of our estimate.
Look at where the common figure of 67 for a 5 sits: at the very bottom of our range. In most of our model runs, a composite of 67 falls short of a 5, so don’t treat 67 as a safe target.
How we estimated the lines
We built the ranges from the College Board’s published score shares and free-response results. We had to assume how students do on the multiple choice, how scores are distributed and how performance on different questions and sections is related.
- The score shares. In 2025, 28.1% of students earned a 5, so the 5 line is the composite that the top 28.1% of students reached. The same reasoning gives every other line.
- Free-response results, point by point. The 2025 Chief Reader report gives the average on each of the 24 free-response points, and the scoring statistics give each question’s spread. We simulated 200,000 students whose free-response point means match the published figures in expectation and whose question spreads approximate the published standard deviations.
- The gap. The College Board publishes nothing about how students do on the multiple-choice section. We gave our simulated students a 42-question section and tried averages of 60%, 65% and 70% correct, each with 18 different settings for how spread out the scores are and the model’s lower bound on the probability of a correct answer.
- The lines. For each of those 54 versions we added the sections with the official weights and found the composites that split the students in the official 2025 proportions, normalized to sum to 100% because the published rounded shares sum to 99.9%. Each range in the table above covers the middle 80% of the 54 results, and the best single guess is the middle result.
| If the average student got this share of multiple-choice questions right | Line for a 5 | Line for a 4 | Line for a 3 | Line for a 2 |
|---|---|---|---|---|
| 55% | 64 | 48 | 32 | 23 |
| 60% | 68 | 51 | 35 | 25 |
| 65% | 71 | 56 | 38 | 28 |
| 70% | 74 | 59 | 41 | 31 |
| 75% | 77 | 63 | 45 | 34 |
We used averages from 60% to 70% because that is where the official score shares and the published estimates agree. The lines most calculators use (67, 54, 42, 31) match an average of about 65% with scores bunched fairly close together, and the set with 72 for a 5 matches about 70%. It is still an assumption, and the table shows what happens if it’s wrong.
We ran two checks. Substituting the 2024 score shares and free-response statistics while keeping the 2027 42-question format gives median lines within 2 points of the 2025-data results. That checks sensitivity to the historical inputs; it does not recover the actual 2024 or 2025 cutoffs. And all four lines that most calculators use fall inside our ranges, at the bottom of the range for a 5 and the top of the range for a 3.
How students actually scored
These are the College Board’s own results for the three AP Precalculus exams so far.
| Year | 5 | 4 | 3 | 2 | 1 | 3 or higher | Students | Mean score |
|---|---|---|---|---|---|---|---|---|
| 2026 | 29% | 29% | 24% | 11% | 7% | 82% | not yet posted | not yet posted |
| 2025 | 28.1% | 25.8% | 26.8% | 11.2% | 8.0% | 80.8% | 253,596 | 3.55 |
| 2024 | 25.9% | 23.9% | 25.9% | 14.6% | 9.8% | 75.6% | 184,394 | 3.42 |
Since 2025, more than half of all students have earned a 4 or a 5. In 2026, 82% scored 3 or higher, the same share as AP Calculus BC and well above Calculus AB (65%) and Statistics (62%). A different group of students takes each exam, so that doesn’t prove AP Precalculus is easier. The exam page goes into what the numbers do and don’t show.
For the free response, the College Board publishes the average on every question, and the averages show how hard those points are to earn.
| Question | 2024 (of 6) | 2025 (of 6) | 2025 average in composite points |
|---|---|---|---|
| 1. Function concepts | 2.95 | 3.51 | 5.48 |
| 2. Modeling a non-periodic context | 2.03 | 2.16 | 3.38 |
| 3. Modeling a periodic context | 2.96 | 3.13 | 4.89 |
| 4. Symbolic manipulations | 1.28 | 1.93 | 3.02 |
| All four | 9.22 of 24 | 10.73 of 24 | 16.77 of 37.5 |
Put the last row next to the score shares. The average student in 2025 earned 10.7 of the 24 free-response points, under 17 of the section’s 37.5 composite points, and yet more than half of all students earned a 4 or a 5. So don’t panic over a free-response total in the low teens. In 2025 that was above average.
What it takes to reach a 3, 4 or 5
Find a free-response total you think you can reach in the first column. The other columns give the number of multiple-choice questions, out of 42, that you’d need with it.
| Free-response points (of 24) | Upper-range target for a 3 (composite 42) | Upper-range target for a 4 (composite 59) | Best guess for a 5 (composite 71) | Upper-range target for a 5 (composite 75) |
|---|---|---|---|---|
| 8 | 20 | 31 | 39 | 42 |
| 10 | 18 | 29 | 37 | 40 |
| 12 | 16 | 27 | 35 | 38 |
| 14 | 14 | 25 | 33 | 36 |
| 16 | 12 | 23 | 31 | 34 |
| 18 | 9 | 21 | 29 | 32 |
| 20 | 7 | 19 | 27 | 30 |
Each free-response point saves you about one multiple-choice question, because the two are worth nearly the same. And reaching our upper target for a 5 needs both sections. All 42 multiple-choice questions right is worth 62.5, which still needs 8 free-response points with it to reach 75.
Where the next points usually are
The Chief Reader report for each exam gives the average on every free-response point, and the same kinds of point came out lowest in 2024 and 2025. Because you know in advance where they are, you can practise for them directly. Each one is worth 1.56 composite points.
| Point | What it asked for | Students who earned it | Lesson |
|---|---|---|---|
| Question 2, part C | Explain, from the context, where the model stops making sense | 5% | 1.13 Model selection and assumptions |
| Question 4, part C, second point | Solve an equation in and for , with the work and no extra values | 10% | 2.13 Exponential and logarithmic equations |
| Question 4, part C, first point | Factor the same equation as a quadratic in | 14% | 2.13 Exponential and logarithmic equations |
| Question 3, part B, second point | Find and in from the period and the starting position | 18% | 3.6 Sinusoidal transformations |
| Question 4, part B(ii) | Rewrite a trigonometric expression so that appears once and no other trigonometric function does | 28% | 3.12 Equivalent trigonometric forms |
| Question 1, part C(ii) | Give the reason an exponential function is the best model, from the table’s values | 30% | 2.5 Exponential models from data |
The first three rows alone are worth 4.7 composite points, more than the distance from our best guess for the 5 line (71) to the top of its range (75). They test ordinary course content. What they take is algebra done carefully without a calculator, and reasons tied to the context and the function’s own values.
The FRQ guide shows what a reason has to contain to earn its point, and the rules that cost points across the exam, such as decimal accuracy in questions 1 and 2.
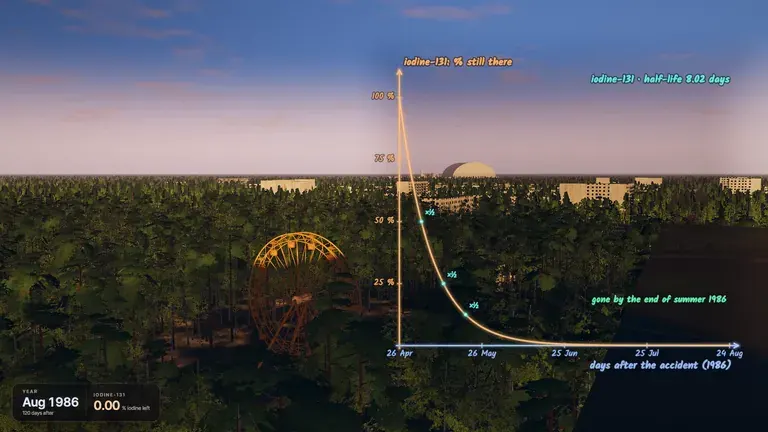
 Topic 1.1319 minFunction Model Selection and Assumption Articulation
 Topic 2.1320 minExponential and Logarithmic Equations and Inequalities
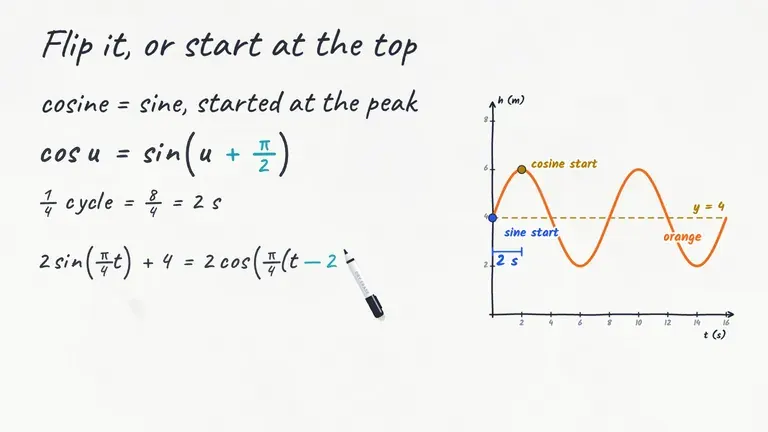 Topic 3.620 minSinusoidal Function Transformations
 Topic 3.1221 minEquivalent Representations of Trigonometric Functions
 Topic 2.523 minExponential Function Context and Data Modeling
Scoring yourself honestly
The free-response boxes are where estimates go wrong. It’s easy to give yourself a point because your answer matched. Readers give it only when the response meets that point’s written rule: some points need the work shown, and a reason point needs the reason, however right the number is.
- Mark with the official scoring guidelines, not from memory of what the answer was. Every released question on AP Central comes with them.
- Take a reason point only if your sentence says why, using this function’s own values or interval. A reason that would fit any function doesn’t earn it.
- Apply the general rules too: decimal approximations accurate to three places when requested in questions 1 and 2, exact values in question 4, and work shown wherever the part asks for it. The first decimal-presentation error in a question can cost its point; later presentation errors in that question are excused under the guidelines. That exception does not excuse incorrect calculations or premature rounding.
- When a point is a toss-up, leave it out. Your estimate then errs low, which is the safe direction.
If three or four points are in doubt, run the calculator both ways. The difference tells you how much is riding on them.
What a 3, 4 or 5 means for college
| AP score | Credit recommendation | College grade it matches |
|---|---|---|
| 5 | Extremely well qualified | A+ or A |
| 4 | Well qualified | A−, B+ or B |
| 3 | Qualified | B−, C+ or C |
| 2 | Possibly qualified | None |
| 1 | No recommendation | None |
Each college decides what a score earns there, and for which course. The College Board says AP Precalculus matches a college precalculus course or a college algebra with trigonometry course. Look up each college you’re considering in its AP credit policy search, because the rule for the same score can differ from one college to the next.
Where to get scores to enter
The best input is a full exam taken under the real timing: 65 minutes for the 29 Part A questions with no calculator, 40 minutes for the 13 in Part B, then 35 minutes for each pair of free-response questions. These official materials are free:
- Released free-response questions from 2024, 2025 and 2026, each with its scoring guidelines. Those exams gave 30 minutes to each pair; give yourself 35, as in 2027.
- The sample exam in the CED: 24 multiple-choice questions with an answer key and four free-response questions with scoring guidelines. It is shorter than a real Section I, so use it for practice rather than for a full estimate.
- Full-length practice exams in AP Classroom, which your teacher can assign.
- The test preview in Bluebook, the College Board’s testing app, to get used to it before May.
Dates, timing and calculator rules are on the exam page. For revision, the AP Precalculus cheat sheets cover each unit, and the formula sheet lists the rules to recall or derive, since the College Board provides none.
Sources
- AP Precalculus Course and Exam Description, effective Fall 2026 (PDF): exam weighting, p. 126; how AP exams are scored, p. 3
- AP Precalculus Exam, AP Central: format, timing and weights for May 2027
- AP Precalculus Clarifications and Corrections, Fall 2026 (PDF): the May 2027 changes, p. 5
- AP Precalculus Score Distributions, AP Students (2024–2026)
- 2026 AP Score Distributions, AP Students (all subjects)
- 2025 AP Precalculus Chief Reader Report (PDF)
- 2024 AP Precalculus Chief Reader Report (PDF)
- 2025 AP Precalculus Scoring Statistics (PDF)
- 2024 AP Precalculus Scoring Statistics (PDF)
- 2025 AP Precalculus Scoring Guidelines (PDF)
- How are AP Exams scored?, AP Students
- Score Setting and Scoring, AP Central
- Implementation of Evidence-Based Standard Setting for Advanced Placement Exams, College Board (PDF)
- AP Precalculus past exam questions and scoring guidelines, AP Central
- AP Precalculus course page, AP Students: college course equivalent
- AP Credit Policy Search, AP Students
- Fiveable AP Precalculus score calculator: comparison checked October 24, 2026
- Albert AP Precalculus score calculator: comparison checked October 24, 2026
- OnePrep AP Precalculus score calculator: comparison checked October 24, 2026
- Num8ers AP Precalculus score calculator: comparison checked October 24, 2026
- Test Ninjas AP Precalculus score calculator: comparison checked October 24, 2026
- APCalculator.org AP Precalculus score calculator: comparison checked October 24, 2026
- 2026 AP Precalculus Scoring Guidelines (PDF): decimal-presentation rules