
Topic 8.3 key terms
- rate in minus rate out
- When an amount has a way in and a way out, its rate of change is the rate in minus the rate out: Q′(t) = r(t) − c for Starfall's line.
- net rate
- Rate in minus rate out, in units of the amount per unit of time (people per minute). Positive: the amount grows. Negative: it shrinks.
- net change
- The integral of a rate of change over an interval: how much the amount went up or down over that interval, in the amount's own units. ∫ₐᵇ Q′(t) dt = Q(b) − Q(a).
- amount at a time
- The starting amount plus the net change: Q(b) = Q(a) + ∫ₐᵇ (rate in − rate out) dt. The integral alone is only the change.
- accumulation function
- A function defined as an integral with a variable upper limit, like Q(t) = 200 + ∫₀ᵗ (r(s) − 30) ds. It accumulates a rate of change; its derivative is the integrand (the Fundamental Theorem of Calculus).
- candidates test (absolute maximum)
- For an amount that is continuous on [a, b]: compare its values at every interior critical point (where its derivative is zero, such as where rate in = rate out, or does not exist) and at both endpoints; the largest is the absolute maximum.
- meaning of an integral in context
- Say what it counts, over which time interval, and in what units: ∫₁₀³⁰ r(t) dt is the number of people who joined the line from t = 10 to t = 30 minutes.
Transcript
2,404 words · 7 parts
Opening night
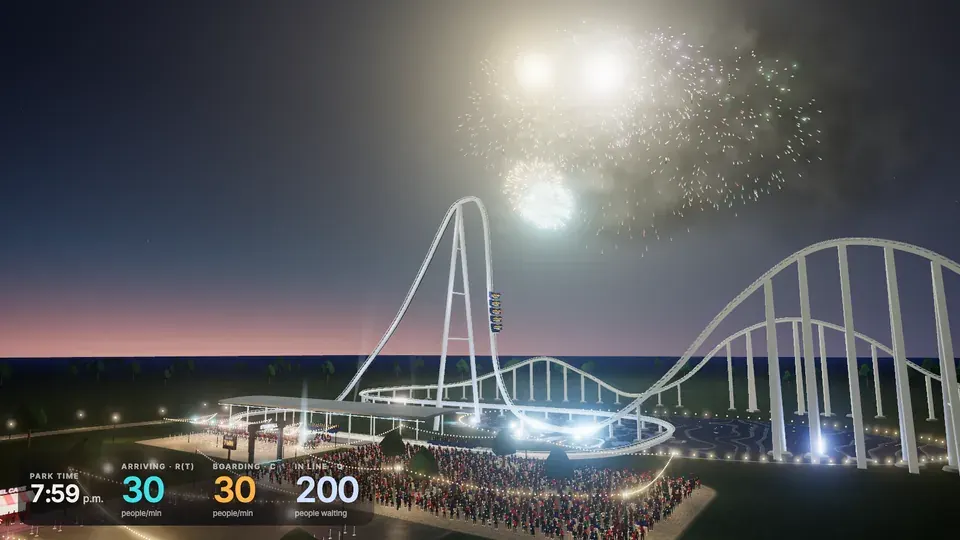
It’s eight o’clock on a warm summer night, and the last of the fireworks are going off over Starfall, the brand-new coaster this whole park has been waiting for. The moment the show ends, it feels like everybody in the park turns around at the same time and heads for the very same place. Here it goes.
People join the line down at this gate, and they leave it up at the station, thirty at a time, every time a train rolls out. Over the next twenty minutes the rush starts to fade, with fewer people joining every single minute, and yet the line keeps getting longer, all the way out of the maze and down the midway.
The rush is slowing down, so surely this line starts shrinking any minute now, and by then the gate will have gone quiet, right? Hold on to those two guesses. Before this lesson is over, you’ll be able to work out exactly when this line is longest, how many people are standing in it, and how long you’d wait if you joined at any moment of the night.
All it takes is two rates, how fast people join and how fast the coaster loads them, plus how many were already here at eight. Let’s rewind to eight o’clock and watch the first minute very closely.
One minute at the gate
In that first minute about ninety people come through the gate, and up at the station exactly one train rolls out with thirty riders on board. That means the line is about sixty people longer than it was a minute ago, because ninety came in and only thirty went out. Let me ask you a sneaky one, though. How many people are in the line at eight-oh-one? It’s tempting to say sixty, but two hundred people were already standing in it before the fireworks even ended.
Sixty is how much the line changed, and about two hundred sixty is how many people are actually in it, and keeping those two numbers apart is half of this lesson. Ninety a minute doesn’t last, of course, and on this night the arrival rate follows a simple rule, r of t equals ninety minus t people per minute, where t counts the minutes after eight.
Let’s put both rates on one graph, the people joining and the coaster’s steady thirty a minute, which we’ll call c, smoothing each trainload of thirty into an even flow. Now I want you to commit to a guess. With these two rates in front of you, at what time do you think Starfall’s line is at its longest?
Hold on to your answer, and let’s run the whole night to check it. Before we run it, plant a flag on the path where you think the end of the line will be when the line is at its longest.
Let’s run the whole night and keep our eyes on the end of the line. It races out at first, then it slows down, and look, at nine o’clock it stops dead, right where the two rates cross.
At nine, people are still joining at thirty a minute, but the coaster is loading thirty a minute too, so for that one instant the line doesn’t change at all. After nine, people never stop coming, but the coaster takes them faster than they arrive, so the line shrinks even though the gate is still busy.
Everything we just watched comes down to one equation. If Q of t is the number of people in line, then Q prime, the rate the line changes, is the rate in minus the rate out. For Starfall that’s ninety minus t, minus thirty, which simplifies to sixty minus t people per minute, and we call it the net rate.
Wherever the teal curve sits above the orange line, Q prime is positive and the line grows, and once it drops below, Q prime turns negative and the line shrinks. Notice that the arrival rate falls the whole night, from the very first minute, and yet the line grows for an hour. A falling rate in doesn’t tell you the line is shrinking. What decides it is which rate is bigger.
Add up the minutes
We know how fast the line grows, but what you really want is how many people are in it. Let’s add the night up in ten-minute chunks, starting with the very first one.
From 8:00 to 8:10, how many people longer does the line get? The next ten minutes add four hundred fifty, then three hundred fifty, and every chunk is smaller than the one before, because the net rate keeps falling.
On the board, each of those chunks is a rectangle under the net rate, as tall as the net rate halfway through. The first one is fifty-five people a minute for ten minutes, five hundred fifty people, the same chunk we saw in the park.
Look at what happens to the units when you multiply, because people per minute times minutes leaves you with just people, and that’s exactly why adding up these rectangles counts people. Add up all six and you get eighteen hundred people. Thinner and thinner slices fill the triangle under the net rate exactly, and that total is the definite integral from zero to sixty of r of t minus c, d t.
The region is a triangle, one half times sixty times sixty, so between eight and nine the line grows by eighteen hundred people, the same total the six chunks gave us. That’s the most important idea in this lesson. When you integrate a rate of change over an interval, you get the net change, how much the amount went up or down over that time.
These next three questions sound almost the same, but they have three different answers, and this is where a lot of students lose points on the exam. First, how many people joined the line between eight and nine? That’s only the rate in, so we integrate r by itself, and the area under r is a trapezoid, the average of ninety and thirty, times sixty, which is thirty-six hundred people.
Second, how much did the line change? Now both rates matter, in minus out, and we already found that one, eighteen hundred people. Third, how many people are in line at nine? For that you start with the two hundred who were already there and add the change, and you get two thousand people.
Let’s make sure that hangs together. The coaster loads thirty a minute for sixty minutes, which is eighteen hundred riders, and thirty-six hundred in minus eighteen hundred out is exactly the eighteen hundred we found. The ride boards eighteen hundred and the line grows by eighteen hundred, but that match is just tonight’s numbers. Arrivals minus riders is what always gives the change.
The classic mistake is to stop at the integral and call eighteen hundred the number in line. The integral only tells you the change, so you always have to add where you started. Let’s push it one step further. Using the same rates, how many people are in Starfall’s line at 9:30, when t is ninety?
If we let the right end of the integral slide, we get a formula for the line at every moment of the night. Q of t equals two hundred plus the integral from zero to t of r of s minus c, d s. The letter inside switches to s, because t is now the moment we’re counting up to, and s is just the clock running from zero to t.
That’s a function defined as an integral, and watch it do exactly what the line did in the park, climbing for an hour, leveling off at nine, and sliding back down after. The Fundamental Theorem from lesson 6.4 says its derivative is just the integrand, r of t minus c, the rate in minus the rate out we started with.
How the exam asks it
This is one of the exam’s favorite questions, and one year it was even about the line for a ride. At what time is the number of people in line the greatest, and then come the words that decide your score, justify your answer. The first move is to set Q prime equal to zero, which is the same as asking when the rate in equals the rate out, and ninety minus t equals thirty gives t equals sixty.
A critical point on its own doesn’t earn the credit, so we check the endpoints too. Q of zero is two hundred, Q of sixty is two thousand, and Q of ninety is fifteen fifty. Then you write the sentence a grader is looking for. The line is longest at t equals sixty, nine o’clock, because sixty is the only critical point and Q of sixty beats Q at both endpoints.
We can justify it with signs too, because Q prime stays positive the whole way before sixty and negative the whole way after. A sign change right at sixty only proves a local maximum, but signs across the whole interval prove it’s the longest. Be careful which function you maximize, too, because the rate in is biggest at eight o’clock, but the question is about Q, the line itself.
Let’s try the other classic. At t equals seventy-five, is the line growing or shrinking, and which reason would earn you the point? The exam’s other favorite is asking what an integral means in context, with units. A full-credit answer always says three things, what it counts, over which stretch of time, and in what units. What does the integral from ten to thirty of r of t, d t, tell you about Starfall’s line?
Run the ride
Let’s head back to the park, because on the second night the crew sends the trains out faster, every forty-five seconds, so Starfall boards forty people a minute instead of thirty. It’s the same rush, ninety minus t, but this time I’ve hidden the count, so all you have to go on are the two rates.
Drag the clock along the night and stop it at the moment you think tonight’s line is the longest it gets. A faster ride doesn’t only make the line shorter, it makes the peak come sooner, because the rush falls to forty a minute before it falls to thirty. The wait sign at the gate does one simple division, the people ahead of you divided by how many the ride loads a minute.
The park promises that nobody waits more than forty-five minutes. Pick the slowest boarding rate that keeps that promise, then watch your whole night play out on the sign.
Same story, water
Let’s go back to Lake Powell in the summer of 1983, from lesson 6.4, when the lake didn’t reach its highest level until six weeks after it was rising fastest. Back then we only looked at how fast the lake was rising, but that rise was really two rates fighting, the Colorado River pouring snowmelt in and the dam letting water out through its turbines and spillways.
All through June the river brought in more water than the dam let out, and apart from one short dip, the lake kept climbing until July fourteenth, its highest day. The very next day the inflow dropped below the release again, and the lake began to fall from its summer high. Look at the Fourth of July, though, when the river dipped below the release for two days and the lake fell a little, then climbed again to its real peak, which is why you always check every candidate.
Now you be the engineer. Starting on June first, find a steady release that would have kept the lake from ever rising above the top of the gates, thirty-seven hundred feet, and try to use as little as you can.
On the exam the same story usually comes as a table, like this one for Splash Canyon, the log flume next door. R is the rate people join and D is the rate the boats load them, just like r and c, and notice that the times in the table aren’t evenly spaced.
To estimate how many joined, we use trapezoids, and each one gets its own width. From zero to two minutes it’s the average of forty and sixty-four, times two minutes, which is a hundred four people.
Use two trapezoids to estimate how many people joined the line from minute five to minute ten. We have a formula for D, so let’s integrate it exactly. An antiderivative is thirty-five t plus t squared, from zero to twelve, and that gives five hundred sixty-four people who boarded.
Start with the five hundred people already in line, add about seven hundred twenty who joined, from all five trapezoids, take away the five hundred sixty-four the boats loaded, and at twelve minutes the line holds about six hundred fifty-six people. At minute seven, seventy people a minute join and the boats load thirty-five plus two times seven, forty-nine, so the line is still growing, by twenty-one people a minute.
Fifty-two minutes
Let’s pull back and look at what we built. How fast an amount changes is the rate in minus the rate out. Integrate that net rate over an interval and you get the net change, measured in the units of the amount itself. Add where you started, and you know how much is there.
Wherever the rate in drops below the rate out, the amount has a peak, and to find the biggest one, you compare all of those moments with both endpoints. The same four lines work for water in a lake, money in a bank account, the charge in your phone, or the carbon dioxide in the air, anything with a way in and a way out.
That brings us back to Starfall’s first night, at eight-thirty, with the wait sign blanked out, so you’re going to work out its number yourself. If you join the line right at 8:30, how many minutes will you wait before you ride?
You just worked out that hidden sign yourself, from two rates and the two hundred people who were there at eight. That’s everything I promised, when the line is longest, how many are in it, and how long you’d wait. Next time you’re staring up at one of those wait signs, you’ll know exactly where its number comes from.