
Topic 6.4 key terms
- accumulation function
- A function defined by a definite integral with a variable limit, such as : for each input x it gives the signed area under f from a to x. Note .
- dummy variable
- The variable inside the integral (t in ). It runs from a to x and never appears in the answer; the input of the accumulation function is the limit x.
- Fundamental Theorem of Calculus, Part 1
- If f is continuous on an interval containing a, then for x in the interval: the rate the accumulated area grows is the height of f at the moving edge.
- chain rule with a variable limit
- : the height at the moving limit times how fast the limit moves.
- relative maximum of an accumulation function
- has a relative maximum where changes from positive to negative. A zero of f without a sign change is not enough.
- concavity of an accumulation function
- Since , g is concave up where f is increasing and concave down where f is decreasing; g has a point of inflection where f changes between increasing and decreasing.
- initial amount plus accumulated change
- An amount whose rate of change is r satisfies ; the constant A(0) does not change the derivative, so .
Transcript
1,152 words · 3 parts
Plywood on the floodgates
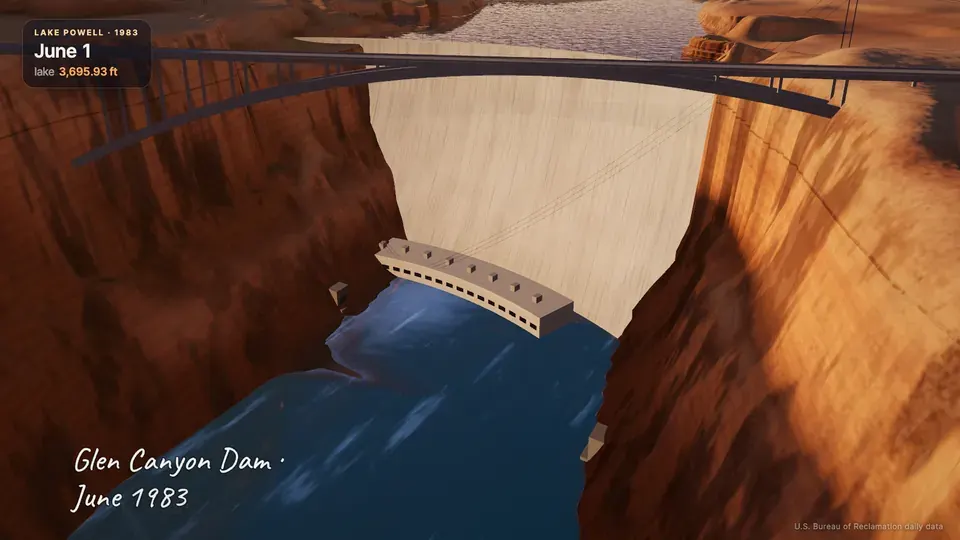
This is Glen Canyon Dam on the Colorado River in Arizona, and in June of 1983 a huge late-spring snowmelt poured down the river into the lake behind it, Lake Powell. Deep inside the canyon wall, the water roaring through the left spillway tunnel had started tearing chunks out of its concrete lining. The lake was still climbing toward the tops of the floodgates, so the engineers bolted sheets of plywood, four feet tall, onto the gates to make them taller.
On the first two days of June the lake climbed almost a foot each day. By the start of July it was only climbing an inch or two a day, but it was still climbing, and nobody could say for sure when it would stop. If you were running this dam, you’d be asking yourself when this lake is finally going to stop rising, and how high it’s going to be when it does.
By the end of this lesson, you’ll be able to answer both of those from a graph of how fast the lake is rising and one starting reading on the gauge. Then I’ll hand you the real numbers from 1983, and you’re going to find the day it peaked yourself. Let’s start with a simpler lake and some rounder numbers, so we can see exactly what’s going on.
A function made of area
This graph tells us how fast our model lake is rising, in feet per week, over an eight-week summer. For the first two weeks the lake rises faster and faster, up to four feet a week. Then it slows down, and after week four the rate goes negative, which means the lake is actually going down.
Before we do any math, I want your gut feeling. Sketch how many feet you think the lake gains, week by week, right on the lower graph.
Let’s run the first two weeks by sliding this blue gate from week zero to week two. The rate climbs steadily from zero to four, so the shaded area under it is a triangle, and half of two times four is four. That area means something real, because feet per week times weeks gives you feet, and sure enough, the lake has risen four feet. Now push the gate ahead to week four and the area grows to eight, so now the lake is eight feet above where it started.
Now let’s let the gate run through the whole summer and watch this second graph, because every point on it is just the area so far. Once the rate goes negative, the new area counts against us, and the lake comes right back down. Lay the real graph next to your sketch and notice where it peaks, because we’re coming back to that in a few minutes.
That second graph is a brand-new function, and we write it as g of x equals the integral from zero to x of r of t, d t, because its output is all the area we’ve collected so far. The x is where we park the gate, and that’s the input. The t is just the variable that walks along the time axis under the curve, from zero up to the gate, so it never shows up in the answer.
Every input gives exactly one output. Put in two and you get four feet, put in four and you get eight, and put in eight and you get zero, because the lake has gone up eight and come back down eight. Notice that g of zero is zero, because a gate parked at the starting line hasn’t swept any area at all, no matter how tall the graph is there.
A definite integral can give us much more than one number. Let the top limit move, and it becomes a whole new function, a running total of everything that’s come in so far.
The newest layer
Now I’d like to know how fast g is growing, because that one question turns all of this into a theorem. Let’s freeze the gate at week three and nudge it forward by one week.
All the water that was already in the lake stays right where it was. The only thing that’s new is this one strip of area, and look, it lands on the lake as a single new layer of water, exactly one foot thick. We gained one foot over the whole week, so our average rate was one foot per week, but right at week three the graph says the lake is rising at two feet per week.
The rate fell from two all the way to zero during that week, so one foot per week is only the week’s average, and our nudge was too big. Let’s make the nudge smaller and compare the two rates again. Half a week adds three quarters of a foot, and that’s a rate of one and a half feet per week.
A tenth of a week adds just nineteen hundredths of a foot, a rate of one point nine. The thinner the layer gets, the closer the rate gets to two. That number, two, is the slope of g at week three. It’s exactly the height of the rate graph, right at the gate.
Let’s write down what we just watched. Call the spot where the gate stands x, and the size of our nudge h. A moment ago, x was week three and h was one week. The new amount is g of x plus h minus g of x. All of the old area cancels, so that difference is just the integral over the thin new strip.
That strip is so thin that it’s almost a rectangle, r of x tall and h wide, so the new amount is about r of x times h. Divide by h, and we’re left with about r of x. As h shrinks to zero, that “about” turns into “exactly”. The left side is now the definition of the derivative, so g prime of x is r of x. The slope of the area function is the height of the original curve.
Okay, now I want you to use it. In our model summer, what’s g prime of seven, the rate the lake’s level is changing at week seven?
This is the Fundamental Theorem of Calculus, or at least the first part of it. For any continuous function f and any starting point a, the derivative of the integral from a to x of f of t, d t, is just f of x. In words, the rate the area grows is the height of the curve at the moving edge.
Notice that the starting point a never shows up in the answer, because everything before the strip cancels when we subtract. We need f to be continuous so that the height of that thin strip really does settle down to one number as it shrinks.