
Topic 4.1 key terms
- parametric function
- A pair of functions x(t) and y(t) of one input t, written f(t) = (x(t), y(t)). Each value of t gives exactly one point in the plane.
- parameter
- The input t that both coordinate functions share. It can be any allowed number (negative too) and is often, but not always, time.
- table of values
- Evaluate x(t) and y(t) at the same values of t; each row gives one point (x(t), y(t)).
- order of increasing t
- A parametric graph is sketched by joining its points in order of increasing t (not left to right); arrows show the direction.
- start and end points
- If the domain is a ≤ t ≤ b, the graph starts at f(a) and ends at f(b).
- vertical line test (parametric)
- A parametric curve can cross a vertical line twice and still be a function of t, because each value of t gives exactly one point; it just isn't the graph of y as a function of x.
Transcript
2,424 words · 7 parts
Two mirrors, one dot
This is the Geirangerfjord in Norway, a little after midnight in late June, and even though the sun went down over an hour ago, this far north the summer sky never really gets dark. And somebody is drawing on that cliff across the water, on a wall of rock four hundred meters tall, with a single laser.
Every one of these pictures is really just one dot of light, racing around the shape about fifty times every second, so fast that your eyes see the whole picture at once. So how fast do you think that one dot is moving across the rock? Something like twenty kilometers a second, which is more than twice as fast as the space station.
So how does one dot draw a heart? Inside the projector there’s no picture at all, just one beam of light and two tiny mirrors, each one smaller than your fingernail. One mirror tilts the beam left and right, the other tilts it up and down, and each one follows its own formula, while both of them listen to the same clock.
By the end of this lesson, you’ll be able to read the two formulas that steer a laser like this one, work out exactly where the dot is at any moment, and program this heart yourself, starting and stopping it exactly where you choose. So let’s slow everything way down and give the laser a much simpler job, so we can watch both mirrors at work.
One clock
Here’s the laser slowed right down until it’s just one dot, with a trail behind it so we can see where it’s been, and here’s its new job. The x mirror follows the formula x of t equals t squared, and the y mirror follows y of t equals t, and both of them use the same input, t, running from negative two up to two.
Let’s start the clock at t equals negative two. The x mirror squares it and gets four, so it swings the dot four units to the right, and the y mirror just uses negative two, so it swings the dot two units down. So at t equals negative two, the dot sits at the point four, negative two. One value of t went in, and one point came out, with two coordinates, one from each mirror.
Now watch what each mirror does on its own. I’ll freeze the y mirror in the middle, so the dot can only slide left and right along the axis, and let the clock run. The x mirror swings the dot left to zero and then back out to four, because t squared shrinks and then grows again, but on its own it can only draw a line.
Now I’ll freeze the x mirror in the middle instead, and the y mirror just walks the dot straight up, from negative two to two, at a perfectly steady pace. Now let both mirrors listen to the clock together, and watch the dot draw a curve that neither mirror could draw on its own.
At t equals negative one it’s at one, negative one, at zero it’s at the origin, at t equals one it’s up at one, one, and at two it finishes at four, two. So the whole idea fits in one machine, with one clock and two mirrors, and for every value of t you get exactly one point.
There’s a little target ring on the rock at the point one, one. Drag t until the dot lands in it, and keep an eye on the readouts as you go.
Write it down
Here’s the drawing the laser just made, copied onto paper, and now let’s write down exactly what the machine was doing. Mathematicians bundle the two mirrors’ formulas into one function and write it as f of t equals x of t, comma, y of t. You feed it one input, t, and it hands you back one point. Here x and y aren’t numbers you pick, they’re the names of two functions, one for each coordinate. And the t inside both of them is the very same t.
For our laser, x of t is t squared and y of t is just t, and we let t run from negative two to two. We call t the parameter, and that’s why this is called a parametric function. Here t is just the input, so it can be negative, and it doesn’t even have to be time, although it often is.
Here’s another way to see the two mirrors. Up top is x of t on its own, plotted against t, and it’s an ordinary parabola. Underneath is y of t on its own, and it’s an ordinary straight line.
Now run t from negative two to two, and watch all three at once, because the same t picks a height on each little graph, and those two numbers are exactly where the dot goes. So the picture isn’t the graph of either formula. It’s what you get when you pair them up, one value of t at a time.
Let’s work out one point by hand, the way the projector’s software does. To find f of negative one, we put negative one into both formulas at once. Negative one squared is positive one, so x is one, and y is negative one, which gives us the point one, negative one. And I kept the parentheses around negative one on purpose, because without them it’s easy to square just the one and get the sign wrong.
Do the same for every whole number from negative two to two, and we get a table with t on the left, then x and y, and then the point they make together. Every row uses one value of t in both formulas. Mix up the rows, taking x from the t equals zero row and y from the t equals one row, and you get zero, one, a point the laser never visits.
Here’s a new one for you, g of t equals three minus t, comma, t squared minus one. Where does g put the dot when t is two?
Follow t, not x
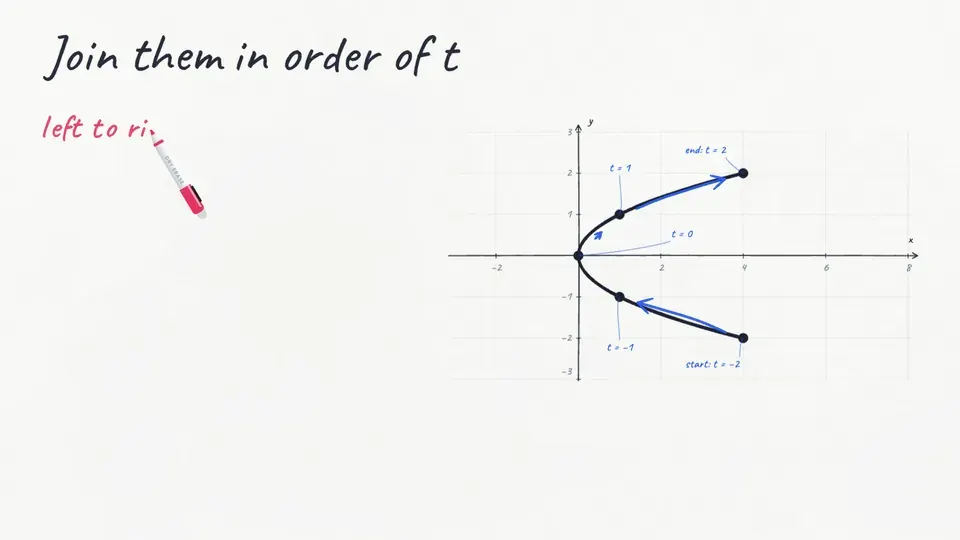
Now let’s put those five points on a graph. I’ll label each one with its value of t, because the picture itself has nowhere to show t. Then we join them in order of t, starting at t equals negative two and ending at two, which is the order the laser drew them in. The arrows show which way the dot travels.
The domain starts at negative two and stops at two, so the drawing has a real starting point, at four, negative two, and a real ending point, at four, two. Here’s the mistake almost everybody makes the first time. If you join the points from left to right, the way you would for an ordinary graph, you get this zigzag, and that’s not what the laser draws at all.
The order comes from t, not from x. The dot starts on the right, moves in toward the origin, and then heads back out to the right again. That’s why the table matters so much. Without those blue labels, you can’t see the value of t anywhere on the picture, so the table is where the order lives.
Now here’s something that might bother you. Draw the vertical line x equals one, and it hits our curve twice. Back in algebra, you learned the vertical line test, which says that if a vertical line hits a graph twice, it isn’t the graph of a function, because one x would have two different y values.
Think back to the target ring on the cliff, and look at when the dot was there. It passed x equals one at t equals negative one, down at one, negative one, and again at t equals one, up at one, one. So the line x equals one hits this curve twice. Is f still a function, and why?
What the vertical line test really tells you is that this picture isn’t the graph of y as a function of x, and that’s fine, because it was never meant to be. And it’s also fine for two different values of t to land on the same point, because a drawing is allowed to come back to a spot it already visited, like a heart that finishes right where it started.
Start here, stop there
Back on the cliff, the laser’s been drawing from t equals negative two to t equals two the whole time. That whole interval, every t from negative two to two, is the domain, and where it starts and stops is a choice we make. Watch what happens if I start the clock at zero instead. The whole bottom half disappears, and the drawing now starts right at the origin, because f of zero is zero, zero.
And if I stop it at t equals one, the drawing ends at one, one. Nothing outside the domain ever gets lit. So the domain decides where a drawing starts and where it stops, which means that if t runs from a to b, the start is f of a, and the end is f of b.
Now you set the domain. Make the laser start its drawing at the point one, negative one, and still finish at four, two. Let’s give the laser formulas you already know from the unit circle: x of t equals cosine t, and y of t equals sine t, with t running from zero to pi.
Let’s call this function c. At t equals zero, cosine is one and sine is zero, so the drawing starts at one, zero. At pi over two it’s at zero, one, the very top, and at pi it ends at negative one, zero. So with this domain, the laser draws just the top half of the circle, counterclockwise, starting on the right and finishing on the left.
Here’s a trap that catches a lot of people with graphing apps. Some of them, Desmos for one, start t at zero and stop it at one unless you change it, and then you get this short arc, just one radian around, ending at about point five four, point eight four.
Nothing’s wrong with the formulas there. When part of a curve is missing, the first thing to check is the domain. Same formulas, but now t runs from zero to three pi over two. Where does the drawing end?
Domains can surprise you in one more way. Here are two different parametric functions: p of t equals t, comma, t squared, from negative two to two, and q of t equals two t, comma, four t squared, from negative one to one.
Plot them, and they draw exactly the same picture, the parabola y equals x squared, from negative two, four, over to two, four. For q that’s because four t squared is the same as two t, squared, which is x squared. But they’re not the same function. Put in t equals one, and p gives you one, one, while q gives you two, four. A picture alone can’t tell you which function drew it, or when it got to each point.
Program the heart
Now let’s go back to where we started. Here’s the heart, and here are the two formulas the projector is following. They look scary, but you already know everything you need to read them, because all you do is put in a value of t, work out x and y, and you’ve found the dot.
Let’s call the heart’s function h, and start at t equals zero. Sine of zero is zero, so x is zero. And every cosine of zero is one, so y is thirteen minus five minus two minus one, which is five. The dot starts at zero, five, in the little dip at the top of the heart.
At pi over two, sine is one, so x is sixteen. For y, the angles t, two t, three t and four t are pi over two, pi, three pi over two and two pi. Cosine of pi over two is zero, cosine of pi is negative one, cosine of three pi over two is zero, and cosine of two pi is one, so y is zero plus five minus zero minus one, which is four. The dot is at sixteen, four, way out on the right edge.
Here’s one to try on your own: where is the dot when t equals pi? So t equals zero puts the dot in the dip at the top, and t equals pi puts it at the tip at the bottom. Let’s take that back to the laser.
Here’s the heart in slow motion, with the domain running the whole way from zero to two pi. On the left half of the heart, x is negative. So think about when sixteen times sine cubed of t is negative. Now program the laser yourself, and drag the ends of the domain so it draws only the left half of the heart.
And if we open the domain back up, from zero all the way to two pi, the laser draws the whole heart again, fifty times a second. There’s an old story here that the waterfall on this side of the fjord, the one they call the Suitor, has spent centuries trying to win over the Seven Sisters across the water. Tonight, at least, he’s got the right formulas. And you just did exactly what the projector does: you read two formulas, found where the dot goes, and chose where the drawing starts and where it stops.
What to remember
So, before you go, here’s what to take with you. A parametric function feeds one input, t, into two functions at once, and every value of t gives exactly one point, x of t, comma, y of t. To make a table, put the same t into both formulas. To sketch it, join the points in order of increasing t, and draw arrows to show the direction. The domain decides where the drawing starts and where it ends.
And the graph of a parametric function can fail the vertical line test, and it’s still a function, because its input is t, not x. In the next lessons, and again in calculus, you’ll come back to curves like these and ask how fast the dot is moving and in which direction, and that’s how engineers describe almost anything that moves, from a laser dot to a robot arm.