
Topic 4.14 key terms
- transition matrix
- A matrix of the fractions that move between states in one step. In this lesson's convention each column is a starting state (from) and each row an ending state (to), so each column adds up to 1. 'Each hour 10% of the ice group dives in and 20% of the water group climbs out' gives [[0.9, 0.2], [0.1, 0.8]].
- state vector
- A column listing how many (or what share) are in each state at one moment, such as [900, 600]: 900 on the ice, 600 in the water.
- predicting future states
- The next state is the transition matrix times the current state, v₁ = Mv₀. Each new state is the input for the next step, so n steps give vₙ = Mⁿv₀ (not n times one step's change).
- steady state
- A distribution that does not change from one step to the next: Mv = v. The flows between the states are equal, so the counts stay fixed even though individuals keep switching. Repeated multiplication (10, 100, 1000 steps) approaches it.
- predicting past states
- The state one step earlier is the inverse matrix times the current state, M⁻¹v (the inverse exists when det M ≠ 0).
Transcript
2,607 words · 8 parts
The count that won’t move
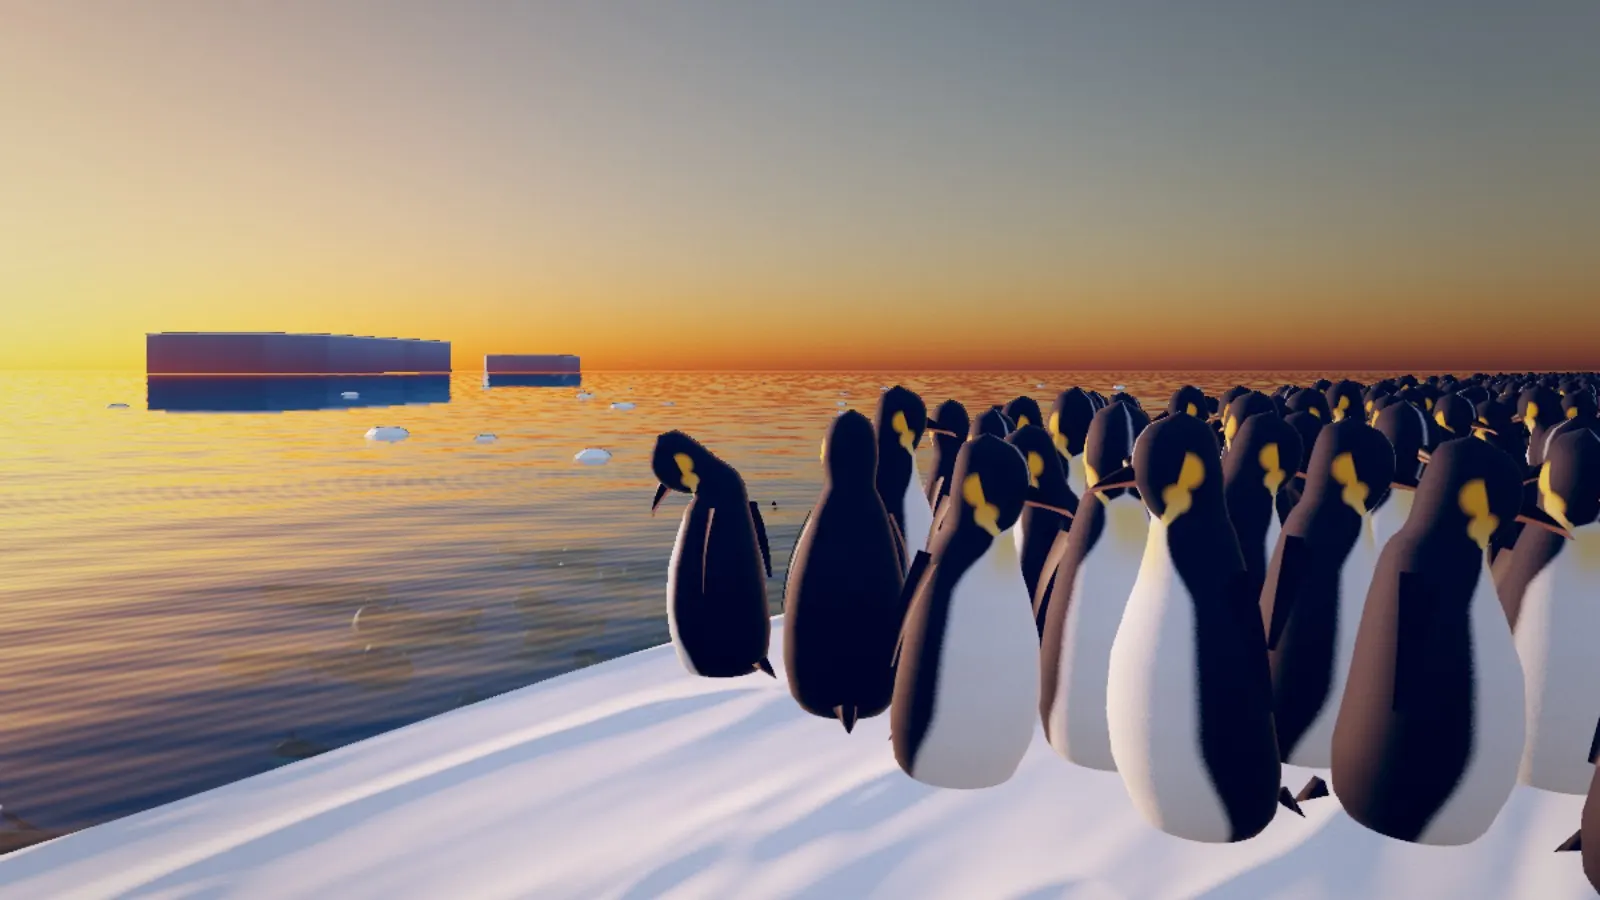
This is the edge of the sea ice in Antarctica, it’s almost midnight, and the sun is still up, because down here in the middle of summer it doesn’t set at all. There are fifteen hundred emperor penguins living along this stretch of the edge, and all day long they do just two things. They dive in after fish. Then they come shooting back out in a cloud of silver bubbles, and land on their bellies.
Nobody stays in one place for long, but watch what happens when we count the penguins standing on the ice, hour after hour. A thousand, and then a thousand, and then a thousand again, while the dives and the launches keep right on coming. So how can a crowd that never stops moving have a number that never changes?
By the end of this lesson, you’ll be able to predict this count an hour from now, tomorrow, or forever, and even run the clock backwards to see how many were here before anybody was watching. And all of it comes from one little grid. It holds just four numbers. So let’s rewind to nine in the morning on day one, when the colony looked a little different, and write down the rule these penguins follow.
Four numbers for one hour
At nine o’clock that morning, there were nine hundred penguins up on the ice. Another six hundred were in the water. Let’s give them a simple rule. Every hour, one in ten of the penguins on the ice dives in, and one in five of the penguins in the water climbs back out.
Real penguins are never quite that tidy. But it’s a good model, and a model is all we need to make predictions. Let’s follow one group at a time, starting with only the penguins who begin the hour on the ice, all nine hundred of them. One in ten of them dives in, and that’s ninety penguins, while the other nine out of ten, eight hundred ten, stay right where they are.
So the ice group’s whole story is two numbers, zero point nine that stay and zero point one that dive, and together they account for every one of them. Now for the six hundred in the water, where one in five climbs out, which is a hundred twenty penguins, and the other four hundred eighty keep swimming, so the water group’s two numbers are zero point two and zero point eight.
That makes four arrows, two that cross the edge and two that stay put, and staying counts just as much as moving. Those four numbers are our little grid, a transition matrix, with one column for each place a penguin can start the hour, and one row for each place it can end up.
The matrix is yours to build. Drag each of the four numbers into the spot where it belongs. Let’s take this grid and its arrows over to the whiteboard. There’s more hiding in them than it looks.
Here’s our matrix, M, on the board, with its columns labeled from the ice and from the water. Its rows say to the ice and to the water. Look down the first column, zero point nine plus zero point one, and that’s one, and down the second, zero point two plus zero point eight, which is also one. That’s no accident, because each column follows everybody who started in one place, and every one of them has to end up somewhere.
And the percents go in as decimals, ten percent as zero point one, because we’re about to multiply with them. The easiest mistake here is to write the ice group’s two numbers across the top row, instead of down the first column. That puts zero point one up in the top right corner. But then the first column adds up to one point one, as if penguins could appear out of nowhere, so remember that the columns are always where you start.
One hour later
Now let’s watch one hour go by and see where everybody ends up. The ninety divers walk to the edge and drop in, and the hundred twenty climbers come launching up out of the water.
At ten o’clock the ice has the eight hundred ten who stayed plus the hundred twenty who climbed out, nine hundred thirty in all, and the water has the ninety who dove in plus the four hundred eighty who stayed, five hundred seventy. And nine hundred thirty plus five hundred seventy is still fifteen hundred, so nobody got lost along the way.
On the board we write the nine o’clock count as a column, nine hundred on top for the ice and six hundred underneath for the water, and a column like that is called a state vector. The count at ten o’clock is our matrix M times that vector. For the top number we go along the top row of M and down the vector, zero point nine times nine hundred plus zero point two times six hundred, which is eight hundred ten plus a hundred twenty, nine hundred thirty.
And the bottom row gives zero point one times nine hundred plus zero point eight times six hundred, which is ninety plus four hundred eighty, five hundred seventy. Those are exactly the sums we watched happen on the ice, so multiplying by the matrix is just a tidy way of following every group at once.
On a different day at noon there are twelve hundred penguins on the ice and three hundred in the water. How many will be on the ice at one o’clock?
Hour after hour
So what happens at eleven? The ten o’clock count becomes the starting point for the next hour, so the output of one hour turns into the input of the next. Multiply M by nine thirty and five seventy, and the top row gives eight hundred thirty-seven plus a hundred fourteen, nine hundred fifty-one, while the bottom row gives ninety-three plus four fifty-six, five hundred forty-nine.
Notice the ice went up by twenty-one this time, not thirty. If it kept gaining thirty every hour, then by tomorrow morning there’d be more penguins on the ice than there are penguins. Since v two is M times v one, and v one is M times v zero, two hours is M times M times v zero, which we write as M squared times v zero. Every hour is one more multiplication by M, so after n hours the state is M to the n times the starting state.
Let’s keep going and track the ice count hour by hour, nine hundred, nine hundred thirty, nine hundred fifty-one, then about nine sixty-six and nine seventy-six. Now how much does it grow each hour? From nine o’clock to ten it goes from nine hundred to nine hundred thirty, and nine hundred thirty minus nine hundred is thirty, and the same subtraction down the table gives twenty-one, then fourteen point seven, then about ten.
The count keeps climbing. But every hour, it climbs by less than the hour before. Let’s say the hours keep going like this, all day and all night. Where do you think the count on the ice ends up?
Here’s the colony running on from one o’clock, hour after hour, and by seven in the evening, ten hours after we started, there are about nine hundred ninety-seven on the ice. Let’s have the computer jump a hundred hours ahead, and then a thousand, and both times the count reads a thousand on the ice and five hundred in the water, the very same numbers we counted at midnight.
Here’s a completely different start, the morning after a storm, when every single penguin is up on the ice. The count starts at fifteen hundred and comes down, thirteen fifty, twelve forty-five, and keeps closing in, and a hundred hours later it’s sitting on the same thousand. And if all fifteen hundred start out in the water fishing, the ice fills up from zero, and a hundred hours later it’s at a thousand again.
On the graph, the three runs come in from above and below. They all squeeze onto the same line, a thousand penguins on the ice. For this rule, it doesn’t matter at all where the colony starts. It always ends up in the same place.
Moving, but not changing
So let’s go back to the night from the very beginning. Now we can finally answer our question. In one hour, one in ten of the thousand penguins on the ice dives in, which is a hundred, and one in five of the five hundred in the water climbs out, which is also a hundred.
Ten percent of a big group is exactly as many penguins as twenty percent of a group half its size, so every hour a hundred go in and a hundred come out, and the count on the ice never changes. The penguins never stop moving, but the two streams are in balance, and that balance is what we call a steady state.
We can find that balance without running a single hour, just by asking when the two flows are equal. If A is the number on the ice and B the number in the water, balance means zero point one A equals zero point two B, and of course A plus B is fifteen hundred.
The first equation says A is twice B, so A plus B is two B’s plus one more, three B’s in all, and three B’s make fifteen hundred, which makes B five hundred and A a thousand. And M times a thousand and five hundred gives nine hundred plus a hundred on top and a hundred plus four hundred underneath, exactly what we put in. So in the language of matrices, a steady state is a state the matrix leaves unchanged, and in symbols that’s just M times v equals v.
As shares of the colony, that’s two thirds on the ice. The other third is in the water. You can also watch the gap between the morning’s ice count and a thousand, a hundred, then seventy, then forty-nine, shrinking by the same factor of zero point seven every hour, just like the geometric sequences in Unit 2. So every hour the colony closes thirty percent of the gap that’s left, which is why it creeps closer and closer to a thousand and never goes past it.
Two bike docks share four hundred bikes. Every day, thirty percent of Dock A’s bikes end up at Dock B, and ten percent of Dock B’s bikes end up at Dock A. In the long run, how many bikes are at Dock A?
Running the clock backwards
Now let’s run the clock backwards. Suppose the research drone only got here at eleven on day one, and its first photo showed nine hundred fifty-one penguins on the ice and five hundred forty-nine in the water.
Can we work out what the colony looked like at nine, before anybody was watching? If we could run time backwards, every launch would turn into a dive and every dive into a launch, bubbles and all, and the count would roll back to nine hundred thirty at ten o’clock, and nine hundred at nine.
Going forward one hour means multiplying by M, so going back one hour means undoing that multiplication, and the matrix that undoes M is its inverse, M inverse. Here’s M again, with zero point nine and zero point eight on its main diagonal, and zero point two and zero point one in the other two spots.
For a two by two matrix, the inverse starts with the determinant, zero point nine times zero point eight minus zero point two times zero point one, which is zero point seven, and since that isn’t zero, M has an inverse. To build the inverse, first we swap the two numbers on the main diagonal, so zero point eight goes on top and zero point nine goes on the bottom.
Then we flip the signs of the other two, so they become negative zero point two and negative zero point one. And last, we divide everything by the determinant, zero point seven, and that’s M inverse.
Multiply M inverse by nine fifty-one and five forty-nine, and for the top row, zero point eight times nine fifty-one minus zero point two times five forty-nine is six hundred fifty-one, and divided by zero point seven that’s nine hundred thirty. The bottom row is negative zero point one times nine fifty-one plus zero point nine times five forty-nine, which is three ninety-nine, and divided by zero point seven that’s five hundred seventy.
That’s ten o’clock, so let’s do it once more, and M inverse times nine thirty and five seventy gives nine hundred and six hundred, exactly the colony we started with at nine. And going forward again checks it, because M times nine hundred and six hundred really does give nine thirty and five seventy.
On another day, the three o’clock count is nine hundred seventy-two on the ice and five hundred twenty-eight in the water. How many penguins were on the ice at two o’clock?
Change the balance
So what happens when the rule itself changes? On that same night from the very beginning, a few hours after midnight, a huge shoal of fish drifts in under the ice edge, and with dinner this close, a lot more penguins go fishing.
Up on the ice the count starts to drop, eight hundred, then seven hundred, then six hundred fifty, and by the next evening the scientists count six hundred on the ice and nine hundred in the water. The climbing-out rate hasn’t changed, it’s still one in five, so the only thing that changed is how often they dive.
The dive rate is in your hands now. Turn it until the colony settles at six hundred on the ice. Three tenths of six hundred and one fifth of nine hundred are both a hundred eighty, so the new balance holds just the way the old one did. Fewer penguins on the ice and more in the water, and the colony settles into its new steady state.
The new rule is a new matrix, with zero point seven and zero point three in the ice column, and the water column the same as before. Multiply it by six hundred and nine hundred, and six hundred and nine hundred come right back out, so that’s the new steady state. Scientists really do count penguin colonies in satellite photos, and a photo of this ice would show only six hundred birds, as if four hundred had vanished, but every one of them is still here, just out fishing more often.
What four numbers can do
So here’s what that little grid can do. Each column is where a penguin starts the hour, and each column adds up to one. The matrix times the state gives you the next hour, and n multiplications give you n hours. Keep multiplying and you close in on the steady state, where M times v equals v and the flows each way are equal, even though nobody ever stops moving. And M inverse takes you back one hour at a time.
So now you can predict the next hour, forever, and backwards, which is exactly what we promised at the start. Models like this are called Markov chains. With many more than two states, the same search for a steady state was the big idea behind how Google first ranked pages on the web. And down on the ice, the penguins just keep diving in and launching out, with no idea that their numbers are perfectly in balance.