
Topic 2.11 key terms
- logarithmic function (general form)
- with , , . Richter's magnitude has , .
- proportional inputs over equal-length output intervals
- For , equal output steps of size come from multiplying the input by the same factor ( in, out; with , in, out). A horizontal shift hides the pattern; undoing the shift restores it.
- concave down / concave up
- Over equal-length input intervals, the average rate of change of () keeps decreasing: concave down. A log function in general form is concave down when it increases and concave up when it decreases, and never has a point of inflection.
- unbounded end behavior
- : every doubling (or ) still adds the same amount, forever. A log function has no horizontal asymptote.
- domain and range
- For the domain is (no power of is 0 or negative) and the range is all real numbers; a shifted log has domain .
- vertical asymptote
- Every log function in general form is vertically asymptotic to : .
- extrema on a closed interval
- A log function has no maximum or minimum on its domain; on a closed interval with the extremes are at the endpoints.
Transcript
2,617 words · 8 parts
Taller than Everest
In nineteen thirty-five, at a lab in Pasadena, California, Charles Richter found a way to give every earthquake a number. He used a beam of light like this one, writing on a turning drum of photographic paper, and whenever the ground shook, the line swung. A magnitude three earthquake a hundred kilometers away swings it about one millimeter, which you can barely see. A four swings it ten times farther, about a centimeter, and a five swings it ten times farther again, ten centimeters, which fills the whole drum.
Magnitude nine earthquakes really happen, and Japan had one in twenty eleven. So if Richter’s drum were big enough, how far do you think a magnitude nine would swing this line? So let’s turn it up. Six is a full meter. The line runs off the paper and up the wall.
Seven is ten meters. It goes straight out through the roof. Eight is a hundred meters, as tall as a skyscraper, and nine is a whole kilometer, higher than the Burj Khalifa in Dubai. And a magnitude ten would swing this line ten kilometers into the sky, higher than Mount Everest.
A magnitude ten has never happened. On this planet it can’t, because the crack in the ground would have to wrap around most of the Earth. But the scale itself doesn’t stop at ten, and it doesn’t stop at zero either, because scientists have measured earthquakes with a magnitude of minus four.
By the end of this lesson, you’ll know how an earthquake can have a negative magnitude and why this scale has no top, even though our planet does, and you’ll read any logarithmic function the way a seismologist reads this line. And at the very end, you’ll take the dial and make this line exactly as tall as Mount Everest. So let’s start where Richter started, with a line that barely moves.
Ten times the swing, one step up
Richter had to pick a starting point, so he took a swing of one micrometer, a thousandth of a millimeter, and called that magnitude zero. From there, every time the swing gets ten times bigger, the magnitude goes up by one, so ten micrometers is a one, a hundred micrometers is a two, and a millimeter is a three. Counting how many times you multiply by ten is exactly what a logarithm does, so Richter’s magnitude is the log base ten of the swing, measured in micrometers.
Let’s see what that function looks like. I’ll grow the swing at a perfectly steady pace, from nothing up to ten meters. The magnitude shoots up at first, reaching three by the first millimeter and six by the first meter, and then it spends the last nine meters crawling from six to seven. That bend is the shape of a logarithmic function, so let’s write Richter’s rule down properly on the board.
Here’s Richter’s rule as a table. The swings go one, ten, a hundred, a thousand, ten thousand micrometers, and the magnitudes go zero, one, two, three, four. Look at how each column changes. Going down the swings, you multiply by ten every time, and going down the magnitudes, you add one every time.
That’s the fingerprint of a logarithmic function. The outputs go up in equal steps while the inputs get multiplied by the same number, and in the AP course you’ll see that same idea written as outputs changing additively while inputs change multiplicatively. In general, a logarithmic function is f of x equals a times log base b of x, with a base that’s positive and not one, and an a that isn’t zero. Richter’s is the simplest kind, with a equal to one and b equal to ten.
The base sets the multiplier. With base two, every time you double the input, the output goes up by one. So if f of five is about two point three two, f of forty is quick to find, because forty is five doubled three times, so it’s three steps higher, about five point three two.
The tower that never stops leaning
That slow crawl raises a real question. If every step up needs more input than the last one, does a logarithm ever hit a top? Let’s test that with a puzzle from old physics books. How far out over an edge can you stack books before the stack tips over?
Start with a single book. You can slide it out until its middle sits right on the edge. Then it hangs out half of a book length. Slide a second book in underneath and push the stack out until its balance point sits on the edge again. Do it twice more, and with four books the top book is completely past the edge.
Look at the steps. The top book sticks out half a length past the next, then a quarter, then a sixth, so each new book helps a little less. The first book length of lean took four books. So how many books do you think it takes to lean out two whole book lengths?
Let’s pour them in and watch. It takes thirty-one books to reach two book lengths. Three lengths takes two hundred twenty-seven books, and four takes one thousand six hundred seventy-four, a tower fifty meters tall. And five book lengths takes twelve thousand three hundred sixty-seven books. That’s a tower taller than the Eiffel Tower, leaning out over the sea by more than a meter.
So every extra book length costs more than seven times as many books. Multiply the input, and the output goes up by one, which means this overhang is a logarithm in disguise. And on its graph it really does look like it’s leveling off, so is there some lean that this stack can never reach?
Let’s answer it for a simpler logarithm, log base two of x. Every time the input doubles, the graph climbs one unit, so each step is twice as long as the last and just as tall.
That means each step is half as steep as the one before. From one to two the slope is one, from two to four it’s a half, then a quarter, then an eighth. To call it concave down, we have to compare pieces of equal width, one to two, two to three, three to four. The graph rises one, then about point five eight, then point four two.
So its rate of change keeps falling over equal steps, and that’s exactly what concave down means. But the slowing down never stops the climb. Every step is half as steep and twice as long, so every step still rises one full unit, and there’s never a last step, because you can always double the input again.
So as x goes to infinity, log base two of x goes to infinity too. A slope that keeps shrinking toward zero is not a ceiling. The book tower works the same way. With enough books, it can lean out over the sea as far as you like.
Below zero
Now let’s go the other way, back to Richter’s drum. Magnitude zero is a swing of one micrometer, so what happens when the swing is even smaller? A tenth of a micrometer is one step of ten below zero, so it’s a magnitude minus one, and a hundredth is a minus two.
This next one really happened. Seismologists recorded a magnitude minus four point four deep in a South African gold mine, and on Richter’s drum its swing would be narrower than an atom. They only caught it because their sensors sat in the rock. The crack was just a few dozen meters away. Scientists have even made magnitude minus six earthquakes in a lab, by squeezing a block of rock until it slips.
Now take the dial yourself, and turn it down until the line stops shaking completely, if you can. Minus ten, minus twenty, minus fifty, you’d never get there, because every step down divides the swing by ten, and you can divide by ten forever without reaching zero. So magnitude zero doesn’t mean no earthquake. It means a swing of exactly one micrometer, and a quake with no shaking at all would have no magnitude.
On the graph of log x, which means log base ten, everything we just saw happens at the left end. As x slides toward zero, the outputs drop to minus one, minus two, minus three, with no floor.
So the input has to be bigger than zero, because no power of ten is zero or negative, and the domain is all x greater than zero. The output can be anything, a huge number or minus fifty, so the range is all real numbers. As x approaches zero from the right, log x goes to negative infinity, so the line x equals zero is a vertical asymptote, and the graph gets closer and closer to it without ever touching it.
Let’s use it. Suppose a quake swings the line on Richter’s drum by five hundredths of a micrometer. What’s its magnitude, to the nearest hundredth?
Only two shapes
Step outside the vault and look up at that mountain. That’s Mount Wilson and its observatory, and astronomers have been giving stars magnitudes for about two thousand years. But their scale runs backwards. The brightest star in the night sky is about minus one and a half, the faintest stars you can see are about plus six, and the Sun is minus twenty-six point seven.
In their formula, that shows up as a negative number in front of the log, and a negative a flips the whole graph over. Here’s log base two of x, rising and bending down. Multiply it by negative one and it flips over the x-axis, so now it’s falling and bending up.
Now think about this one for a moment. What happens with a base smaller than one, like log base one half of x? Where will its graph go? It lands exactly on the flipped curve. That’s because one half to the y is two to the negative y.
So two cubed is eight, and one half to the negative three is eight too, which means log base one half of x is just negative log base two of x. So there are really only two shapes. When a is positive and the base is bigger than one, the graph rises and bends down. Flip just one of them, with a negative a or a base below one, and it falls and bends up.
And there can’t be a third shape, because a logarithm is the mirror image of an exponential across the line y equals x, and an exponential always goes one way and bends one way, so its mirror image does too. So a logarithmic function never turns around, which means no maximum or minimum on its whole domain, and it never changes its bend, which means no point of inflection.
This is a classic exam-style question. Take f of x equals four minus three log base ten of x. Statement one says f is decreasing. Statement two says the graph of f is concave up. Statement three says its limit at infinity is four. Take your time with this one. Which of these statements are true?
A window on the drum
So when does a logarithmic function have a biggest value? Picture a recorder that can only read swings between these two stops, from one micrometer up to ten centimeters. On that window the magnitudes run from zero to five, so the biggest one sits right on the right-hand stop.
Take that stop away, and there’s no biggest magnitude anymore, only a smallest one, at the left stop. On its whole domain, a logarithmic function has no maximum and no minimum. Give it a closed interval, and it has both, at the endpoints.
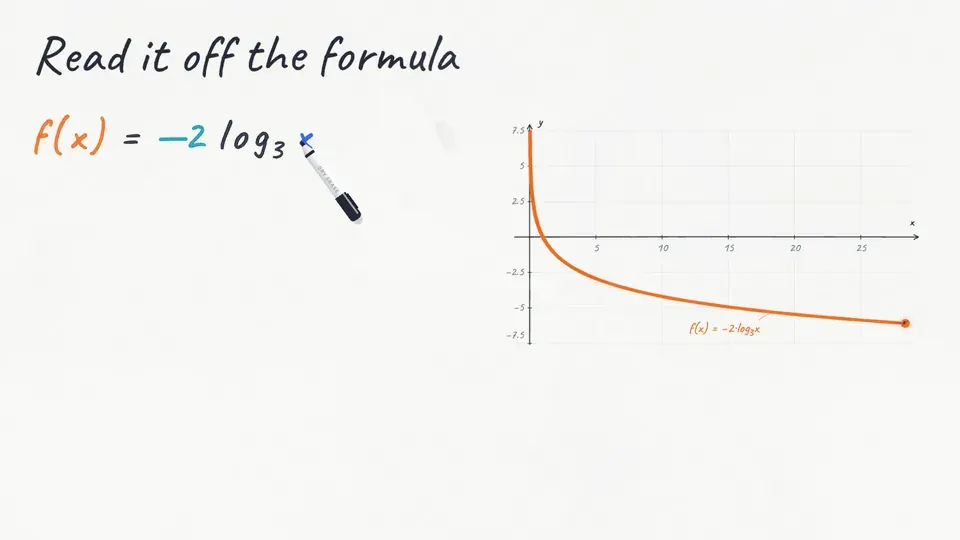
Let’s read everything off a formula. Take f of x equals negative two times log base three of x. It’s still a logarithm, so the domain is x greater than zero and the range is all real numbers, and since the negative two flips it, f is decreasing and concave up. Near the wall it shoots up, so as x approaches zero from the right, f goes to infinity, and as x goes to infinity, f goes to negative infinity. It crosses the x-axis at x equals one, because the log of one is zero.
Now give it a closed interval, from one ninth to twenty-seven. Since f is decreasing, the biggest value is at the left end. One ninth is three to the negative two, so f of one ninth is negative two times negative two, which is four. The smallest value is at the right end, where twenty-seven is three cubed, so f of twenty-seven is negative six. On all of x greater than zero, though, f has no maximum and no minimum.
Now you try one. For g of x equals five times log base one half of x, on the interval from one quarter to eight, what’s the largest value of g?
Is it a logarithm?
Let’s go back to the fingerprint we found in Richter’s table. Here’s log base two of x as a table, with inputs that double every step, from one to thirty-two, and outputs zero to five.
Now slide the whole graph three units to the left. The outputs stay the same, zero to five, but the inputs become negative two, negative one, one, five, thirteen and twenty-nine. Those inputs aren’t proportional at all. Negative one over negative two is a half, one over negative one is negative one, so the constant ratio is gone.
But add three back to every input, and you get one, two, four, eight, sixteen, thirty-two again. A shifted logarithm is still a logarithm. That’s a test you can use. If adding the same number to every input makes them proportional over equal output steps, the function is logarithmic, just shifted.
Let’s finish with one more, the way the exam asks it. This one uses tables of values. Only one of these four tables could come from a logarithm in general form. Look at how the inputs and the outputs change in each one. Which table could come from f of x equals a times log base b of x?
Everest is a 9.95
So here’s everything we found. A logarithmic function in general form only takes inputs bigger than zero, but its outputs reach every real number. It has a wall at x equals zero, where it runs off to infinity or negative infinity. And at the other end, it never levels off.
It always rises or always falls and always bends the same way, so it has no turning points and no inflection points, and it has both a maximum and a minimum only on a closed interval. And its fingerprint is equal steps in the output while the input gets multiplied.
Back in the valley, the biggest earthquake ever recorded struck Chile in nineteen sixty, a magnitude nine point five, on a fault about a thousand kilometers long. The bigger the quake, the longer the fault it needs, and a magnitude ten would need one wrapped around most of the Earth. So our planet has a ceiling, even though the function doesn’t.
So now it’s your turn, like I promised. Take the dial and make this line stand exactly as tall as Mount Everest. So that’s Richter’s line. It has no bottom, because you can always divide the swing by ten one more time, and no top, because you can always multiply it by ten one more time. Every logarithmic function you’ll ever meet works exactly the same way, and the only thing that stops this one is the size of the planet it’s measuring.