
Topic 2.2 key terms
- linear function
- An initial value plus repeated addition of a constant rate of change: . The function form of an arithmetic sequence .
- exponential function
- An initial value times repeated multiplication by a constant ratio: with , , . The function form of a geometric sequence .
- equal-length input intervals
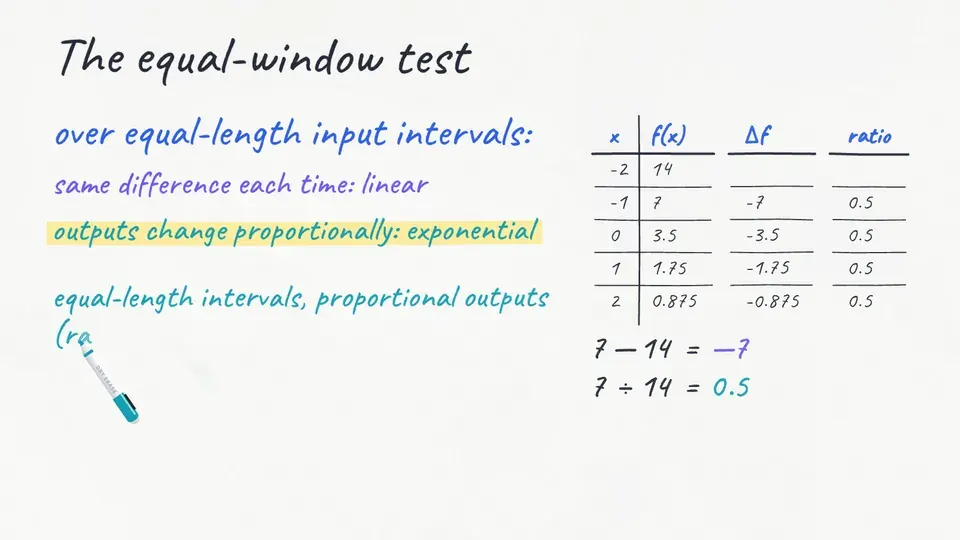
- Windows of the input that all have the same width. Over them, outputs that change by a constant amount mean linear; outputs that change proportionally mean exponential.
- change proportionally
- Each output is the same multiple of the one before it: the ratio of consecutive outputs over equal-length intervals is constant.
- constant ratio
- The factor an exponential function multiplies by over each equal-length interval. It cannot be 0 or 1. Over an interval of length the factor is .
- point-slope form
- : a linear function from a known point and the slope, like .
- point-ratio form
- : an exponential function from a known point and the ratio, like .
- domain of a sequence vs its function
- A sequence is defined on whole numbers; its corresponding function can be defined on all real numbers. Between the whole numbers the function keeps the same kind of step.
Transcript
2,605 words · 8 parts
Rain on an empty desert
That brown haze on the horizon looks like smoke. But watch it for a few seconds, and you’ll see it’s moving on its own. It’s a swarm of desert locusts over Kenya, in early 2020, and one swarm there measured about sixty kilometers long and forty wide, which is nearly the size of Rhode Island.
Every square kilometer of a swarm like that can eat as much food in one day as about thirty-five thousand people. This one covered about two thousand four hundred square kilometers, so in a single day it could eat as much food as about eighty-four million people.
The strangest part is how it started, nearly two years earlier, with two cyclones that dropped rain on one of the emptiest deserts on Earth, the Empty Quarter of Arabia. The sand turned green, and out there, where nobody could get to them, the locusts bred for three generations, each one up to twenty times bigger than the last. By the time people could really see them, swarms were already pouring out of the desert, and by the end of 2019 they’d crossed the sea and reached Kenya.
People fought back with planes, and every pass of a plane like this one sprays one more strip of the same size. By the end of this lesson, you’ll be the one running the spray planes. And you’ll beat the swarm with nothing but two survey counts. Plus one idea, the one that tells adding apart from multiplying. You’ll also see something strange. Against a swarm, every three weeks you wait doubles the planes you need.
Half the sky
But before I hand you the planes, there’s something I want to show you. It’s what this kind of growth does to a normal human brain, mine included. Imagine a swarm that doubles in size every three weeks, and by week thirty it fills this entire sky. Go with your gut on this one. In which week was the swarm half that big?
So let’s run the sky backward, three weeks at a time. In week twenty-seven, it’s half the sky. In week twenty-four, a quarter. And in week twenty-one, an eighth. Three weeks further back it’s a sixteenth, a few dark patches you might not even look up at, and that’s what makes this kind of growth so dangerous, because it looks harmless until the very end.
Most people’s gut says week fifteen, because it’s halfway. But in week fifteen, this swarm filled just one thirty-second of the sky. Our brains love to draw straight lines, and this whole lesson is about teaching yours the other shape.
Plus or times
Let’s watch both sides of this fight, starting with the plane. Say one plane can clear a hundred square kilometers of swarm a week, so every week the cleared ground grows by that same hundred, and from above it looks like the same strip laid down again and again.
Now give the swarm three weeks. It doubles, from whatever size it was to twice that. So the plane adds and the swarm multiplies, and those two words are going to carry us through this whole lesson.
Let’s put both into tables. Say the plane had already cleared five hundred square kilometers by week zero, so every three weeks the total climbs, to eight hundred, eleven hundred, fourteen hundred. And say the swarm covered a thousand in week zero, so every three weeks it goes to two thousand, four thousand, eight thousand. Going down the first table, we add three hundred every time, three weeks at a hundred a week. Going down the second, we multiply by two every time.
Let’s write each table’s last row in a way that shows how we got there. Fourteen hundred is five hundred, plus three hundred, plus three hundred, plus three hundred, which is five hundred plus three times three hundred.
And eight thousand is a thousand, times two, times two, times two, which is a thousand times two to the third. If n counts the three-week steps, the planes’ total is five hundred plus three hundred n, and the swarm is a thousand times two to the n.
Those are last lesson’s two kinds of sequences, arithmetic, a start plus a common difference n times, and geometric, a start times a common ratio n times. And once the input can be any real number at all, not just a whole number, they grow up into functions. One is the linear function, b plus m x, and the other is the exponential function, a times b to the x.
Each one has a starting value and one constant that controls how it changes, and the one real difference between them is the operation, adding for linear and multiplying for exponential. And watch out for the letter b. In the linear function, it’s the starting value. In the exponential function, it’s the number you multiply by.
Same window, same factor
Let’s go back up above Kenya. Here’s a timeline of the swarm and the planes, week by week. This little window covers three weeks. As I slide it along the swarm’s timeline, it reads times two, wherever I put it. On the planes’ timeline the same window always reads plus three hundred, so on both timelines a window of the same width does the same thing wherever you put it, adding on one and multiplying on the other.
One generation can multiply a swarm by twenty, so I want you to stretch the window until it reads times twenty, and see how wide it has to be. Thirteen weeks, about three months, is one locust generation, and wherever you put a thirteen-week window, it reads about times twenty.
And a window just one week wide reads about times one point two six, because multiplying by one point two six three times in a row gets you to about two. So whenever you say how fast something multiplies, say over what window, because times two every three weeks and times one point two six every week are the very same swarm.
Here’s the test the way you’d write it on an exam. Over input intervals of the same length, outputs that change by the same amount mean linear, and outputs that change proportionally mean exponential. Proportionally just means each output is the same multiple of the one before it, like times two every three weeks, or times one half every step.
So each change is always the same fraction of the output it starts from. A big swarm gains a lot in three weeks. A small one gains only a little. This next table is a real one, from the 2025 AP Precalculus exam, with x running from negative two up to two, and f of x starting at fourteen. Subtract neighbors, and seven minus fourteen is negative seven, then negative three and a half, then negative one and three quarters, so the differences keep changing.
Divide instead, and seven over fourteen is one half, and so is every other ratio, exactly one half each time. The exam asked which model fits and why, and the reason that earned the point said that over equal-length input intervals, the outputs change proportionally, each one half of the one before. Most students named the right model. Only about three in ten got the point for the reason. And now you know the sentence that earns it.
And the ratio can never be one or zero, because times one gives five, five, five, five, a flat line, which is linear, and times zero wipes everything out after the very first step. Here’s one with a little trap hidden in it. The inputs are zero, one, three and four, and the outputs are three, six, twenty-four and forty-eight.
Take a moment with it. What kind of function could make this table? So always read the inputs before you divide, because the test only works on windows of the same length.
Between the generations
The UN’s Food and Agriculture Organization, the FAO, tracks locust growth one generation at a time, about three months each, so its numbers come as dots, times one, times twenty, times four hundred, times eight thousand. That’s a sequence, one value for each whole generation, but a forecaster sending out planes needs the swarm’s size in any week at all, including every week between the dots.
Let’s try your gut again. Halfway through a generation, how many times bigger is the swarm than it was at the start? Halfway through, the swarm is only about four and a half times bigger. That’s a lot lower than where most people’s gut puts it.
Here’s why it has to be that low. Each half of the generation is a window of the same length, so each multiplies by the same amount. And the two halves together make twenty, so that amount times itself is twenty, which makes it the square root of twenty, about four point four seven.
Suppose it were ten and a half. Then the second half would multiply by ten and a half again. That lands near a hundred and ten, not twenty. If it were adding instead, halfway really would be halfway, nine and a half up from one. So the sequence lives only on whole generations, the function lives on every moment in between, and in between, each one keeps its own kind of step, adding for linear and multiplying for exponential.
Two surveys, two futures
Now suppose you’re the forecaster. A survey flight measures the swarm at two thousand square kilometers in week three, and a second flight measures eight thousand in week nine. So what will it be in week fifteen? If it’s adding, it gained six thousand in six weeks, which is a thousand a week, so week fifteen gives fourteen thousand.
If it’s multiplying, it multiplied by four over those six weeks, so the next six weeks multiply it by four again, and that’s thirty-two thousand. So the same two surveys give you two very different futures. On the map, one is more than twice the size of the other.
There’s one more reading I haven’t shown you, from week six, halfway between the surveys, where adding says five thousand and multiplying says four thousand. The week-six survey comes back at four thousand, so this swarm is multiplying.
Let’s build both forecasts properly from the two surveys, week three at two thousand, and week nine at eight thousand. For the line, subtract to get the change, eight thousand minus two thousand. Then divide by the six weeks it took, and that gives a slope of a thousand square kilometers a week. Then start from a known point and add the slope once for every week after it, y equals two thousand plus a thousand times the quantity x minus three, which is point-slope form, the twin of an arithmetic sequence written from any term you know.
For the exponential, divide instead, and eight thousand over two thousand is four, but that four is six weeks of growth, six equal factors, so r to the sixth is four, which makes r the sixth root of four, about one point two six. Then start from the same known point and multiply by r once for every week after it, y equals two thousand times one point two six to the power x minus three, the exponential twin, like a geometric sequence written from any term you know.
Here are both forecasts on one graph. They go through the same two surveys. They meet exactly at the two surveys. Between them the line is ahead, and outside them the curve is ahead, which is why a reading from week six could tell them apart. And outside is where it counts, because a growing exponential passes every line in the end, however steep you make the line.
So two points like these pin down exactly one line and exactly one exponential, and the two points on their own can’t tell you which one you’re living in. The 2026 exam asked exactly this kind of question, only with something that shrinks instead of grows.
A car’s value is a times b to the t, with t in years. In thousands of dollars, it’s worth twenty-seven point two after one year, and fourteen point eight after six years. What is b, to three decimal places? It’s the same move as with the swarm, divide and then take a root, but this ratio is less than one, so the car’s value shrinks by the same factor every year.
Run the fleet
Now the planes are yours to run. Your two surveys said this swarm multiplies by about one point two six every week, so each week it adds about a quarter of its own size, twenty-six percent. And each plane clears its hundred square kilometers.
If three planes start in week zero, the swarm adds about two hundred sixty that week and the planes clear three hundred, so it shrinks, and a smaller swarm adds even less, until it’s gone. Now give those same three planes a late start, in week six, when the swarm is four thousand, and it’s adding over a thousand a week, so three planes barely slow it down.
So it’s week six, and the swarm covers four thousand square kilometers. I want the smallest fleet that beats it. Try the slider as many times as you need.
With eleven planes from week six, the planes gain a little every week, and the swarm is gone by week nineteen. Ten planes lose by about forty a week, which sounds like nothing, but the swarm grows on whatever’s left, so forty becomes fifty, then sixty-three, and the gap keeps multiplying.
The swarm still adds twenty-six percent a week, and each plane still clears a hundred square kilometers. Now suppose you didn’t start until week nine, when the swarm is eight thousand square kilometers. What’s the smallest fleet that wins then?
Three weeks of waiting took you from eleven planes to twenty-one, nearly twice as many, because what the swarm adds each week doubled, and that’s the promise from the start of the lesson, every three weeks you wait doubles the planes you need. So let’s send in your twenty-one planes. Watch what happens to the valley.
Look at the edges first. A smaller swarm adds less every week, so the planes gain on it faster and faster. Week after week, they clear more than the swarm can add. You sent them while it was still small enough to beat. And the sky over the valley finally empties.
Adding or multiplying?
Linear functions start somewhere and add the same amount every step, and exponential functions start somewhere and multiply by the same factor every step. To tell them apart, take equal windows and look for the same difference or the same ratio, and remember that the ratio is never zero or one.
Two points, like your two surveys, give you exactly one line and exactly one exponential, subtract and divide for the line, divide and take a root for the exponential. And a sequence lives on whole steps, while its function lives everywhere in between, with the same kind of step all the way down.
In real life, the fight against those swarms worked. Over 2020 and 2021, teams across East Africa and Yemen treated nearly twenty-three thousand square kilometers, and the FAO estimates that the campaign secured food for about forty-one and a half million people. What won was starting early and going big, which is exactly the arithmetic you just did yourself. So the next time someone tells you something is growing exponentially, ask them for two equal windows, and check.