
Topic 2.15 key terms
- semi-log plot
- A graph with one axis logarithmically scaled (base n > 1). In AP Precalculus the log scale is on the y-axis, so data with exponential characteristics appear linear.
- logarithmic scale
- An axis on which equal distances stand for equal ratios: each equal step up multiplies the value by the same factor (×10 per gridline for base 10, unless the axis says otherwise).
- linearization
- Rewriting exponential data or a model y = a·b^x as the line log y = (log b)x + log a by taking logs of the outputs.
- linear rate of change (of the semi-log line)
- The slope of the semi-log line, logₙ b, where b is the growth factor of y = a·b^x. Undo it to get b: b = n^slope.
- initial linear value
- The vertical intercept of the semi-log line, logₙ a, where a is the initial value of y = a·b^x. Undo it to get a: a = n^intercept.
- transformation of an exponential function
- A model such as y = a·b^x + k. If the logs of the outputs trend linear for large inputs, such a model is appropriate, with no need to subtract k first.
- half-life
- The time it takes a decaying quantity to fall to half. On a base-10 semi-log plot it is log 2 ÷ |slope| = 0.301 ÷ |slope|.
Transcript
2,429 words · 9 parts
The star that wasn’t there
This is the sky over a mountain in Chile on the night of February twenty-fourth, nineteen eighty-seven, and those two soft patches of light aren’t clouds. They’re whole galaxies, two of our nearest neighbors. That night, an astronomer working up here developed a photograph of the sky and found a new star beside that pink glow, one that hadn’t been there the night before. It was a star exploding, about a hundred and sixty thousand light-years away, and it was the closest and brightest exploding star anyone had seen in about four hundred years.
Astronomers measured its light night after night for years, and if you draw those measurements on an ordinary graph, you get a spike, and then a line that sinks to the floor and just lies there. It looks like the story’s over after a few months. But hidden in that flat tail is a clue that told astronomers exactly what was keeping this star lit.
By the end of this lesson, you’ll turn that fading light into one straight line, and from its tilt you’ll name the element that kept the star shining, the one that turns into iron, the same kind of iron that’s in your blood. To read a star like that, we need a new kind of ruler, one made for things that multiply, so let’s start closer to home, with the chip inside your phone.
Fifty years in your pocket
The chip inside a twenty twenty-three iPhone Pro has about nineteen billion transistors, the tiny switches that do its thinking, which is more than two for every person on Earth. Back in nineteen seventy-one, the record for one chip was about two thousand three hundred, so let’s put fifty years of record-breaking chips on one graph. On an ordinary graph, it looks like nothing happened for forty years, and then everything happened at once.
Chips weren’t standing still, though. The record chip of nineteen eighty-nine had more than a million transistors, and on this graph it’s about a hundredth of a pixel tall. Watch what happens if we zoom in on the flat part a hundred times. It’s the same wall again, about thirteen years earlier, and another hundred times shows it again.
These chips grew by multiplying, about ten times every seven years, so let’s try a ruler where every times ten gets the same amount of room, and one to ten takes the same height as ten to a hundred. What do you think fifty years of chips will look like on it?
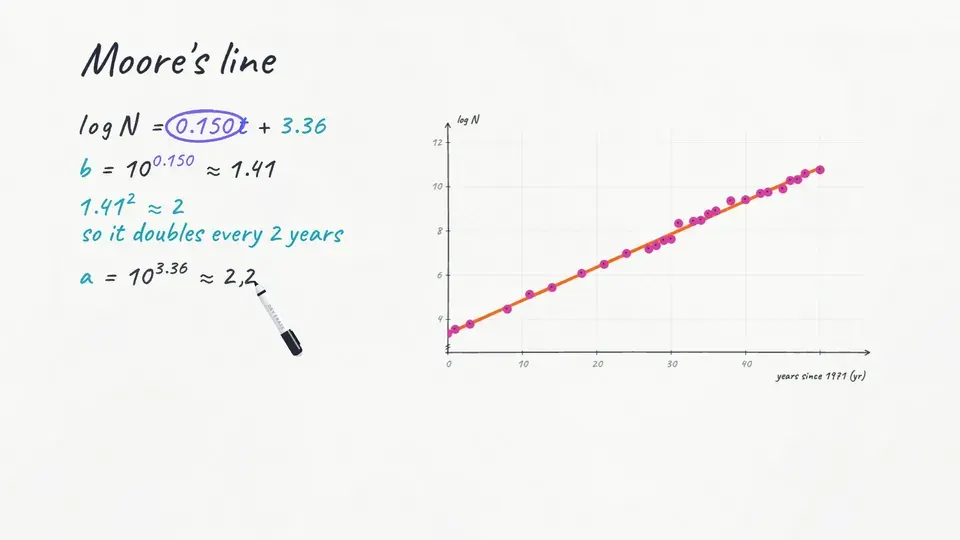
Let’s switch the ruler and watch. Every times ten gets the same room now, and fifty years of chips fall almost perfectly onto one straight line. From about two thousand to fifty-eight billion it’s one steady climb, which means the chips multiplied at the same rate for fifty years. A graph like this, with the vertical axis stretched so every multiplication by ten gets the same room, is called a semi-log plot, because only one of its axes is logarithmic.
The height on that axis is really the log of the value, so a million sits at height six and a billion at height nine, and in this course the log axis is always the y-axis. So that’s the fact we just saw with our own eyes. On a log y-axis, anything that grows exponentially shows up as a straight line.
A ruler for multiplying
But why does it come out straight? Take a simple exponential, three times two to the x, where every step doubles the value: three, six, twelve, twenty-four. On an ordinary ruler the jumps keep growing, three, then six, then twelve, because each one is twice the last, and that’s why the graph curves up. Now let’s switch to the log ruler. Every doubling gets the same room here, so every one of those hops becomes exactly the same climb, about zero point three.
Equal steps across and equal climbs up is exactly what a straight line is, and that climb, zero point three zero one, is the log of two, the factor we keep multiplying by. So an exponential multiplies by the same factor b every step, and a log ruler gives every equal factor the same height, so the result is a straight line whose slope is log b.
And if the factor is less than one, say we keep halving something, every step is the same drop, so a decay shows up as a straight line going down. Keep that in mind, because our star was fading.
Will it level off?
Chicago, December second, nineteen forty-two. In a squash court under the stands of a university football stadium, there’s a huge pile of black graphite bricks with lumps of uranium hidden inside. It’s the first nuclear reactor ever built. Enrico Fermi’s team is trying to make it keep itself going for the first time. Every time they pull a control rod out a little further, the counters click faster, and a pen on a paper chart traces how many neutrons are flying around inside.
After every pull they ask the same question about that pen line. Will it level off? On this pull it climbs and then flattens out, so the pile can’t keep itself going yet. They pull a little more, and the pen runs right off the top of the paper. So someone switches to a range ten times bigger, and the line levels off again.
Look at what that switch really is. Each switch is one more times ten, so stack the ranges on top of each other, each the same height, and you’ve built a log axis by hand. On the log chart, every run that levels off bends over and goes flat, so the question becomes a question about shape. Does the line bend, or does it run straight?
It’s the afternoon now, and it’s your turn at the rod. Pull it out a little at a time, and stop when the line on the log chart stops bending and runs straight.
A straight line means the neutrons were multiplying by the same factor every minute, with nothing to slow them down, so the reaction was feeding itself. They let it run at about half a watt, then dropped the emergency rod back in, and the line fell, in a straight line again, as the neutrons died away by the same factor over and over. So a semi-log plot works as a test. And it’s exactly the test you’ll use on the exam.
If data make a straight line on a semi-log plot, an exponential model fits, and if the line keeps bending, a plain exponential doesn’t. Here’s the real chart from that day, as the Department of Energy later printed it. Under the last climb it says, in capital letters, exponential rise of intensity, with no evidence of leveling off. And near the middle there’s a sharp drop labeled change in scale, which is that same times ten range switch.
Reading the line
A straight line also has a slope and a starting height, and those two numbers hand you the whole function. We start with y equals a times b to the x, and take the log of both sides, because the log is exactly what our vertical axis measures. We’ll use base ten, though any base works.
The log of a product is the sum of the logs. So this one splits in two, log a, plus the log of b to the x. And the log of b to the x lets the x come down in front, so it’s x times log b.
Now call the height on our log axis capital Y. Then Y equals log b times x, plus log a, which is just a line, a slope times x plus a starting height. So the slope is log b, and the starting height is log a, and here are their names, worth knowing for the exam: log b is the linear rate of change, and log a is the initial linear value.
Let’s use it on the chips. Plot the log of every record chip’s count against the years since nineteen seventy-one, fit a line the way you’d fit any line, and you get log N equals zero point one five zero t, plus three point three six.
So the log of the count climbs zero point one five zero every year. By what factor does the number of transistors itself multiply each year? Use the calculator, and round to the nearest hundredth.
And one point four one squared is about two, which means the chips doubled every two years, the famous rule called Moore’s law. The starting height, three point three six, is the log of a, so a is ten to the three point three six, about two thousand three hundred, right where the first chip sits. And that’s a very common mistake on these questions, reading the intercept, three point three six, and calling it a. It’s the log of a, so you always undo it.
A straight line is also easy to extend. Slide along this one to twenty twenty-four and it predicts about two hundred five billion transistors, and NVIDIA’s biggest graphics chip that year had two hundred eight billion.
Straight for large inputs
Real data isn’t always that tidy. Take y equals two times three to the x, plus a hundred, an exponential with a constant added on, and make a table. At first the hundred is most of the value, so y barely moves. It goes a hundred and two, then a hundred and six. Then the three to the x takes over, and y explodes.
Now look at how much log y climbs each step. From x equals zero to x equals one it only goes from two point zero zero nine to two point zero two five, a climb of zero point zero one six. After that the steps keep growing, until they settle near zero point four seven seven, the log of three. On a semi-log plot the start curves up, and then the tail straightens into the line of an exponential that multiplies by three, and nobody ever subtracted the hundred.
So here’s the rule for large inputs. If the logs of the outputs trend toward a straight line as the inputs grow, an exponential, maybe shifted up or down, can model the data, with no constant to remove first.
Here are three data sets on a semi-log plot. Which of them could be modeled by an exponential function, or by an exponential that’s been shifted up or down?
Between the gridlines
One more skill before we go back to the star. On a log axis, halfway between a hundred and a thousand isn’t five hundred fifty. Halfway up means the log is halfway between two and three, so two point five, and ten to the two point five is about three hundred sixteen.
You can check it by multiplying. A hundred times three point one six is about three hundred sixteen, and three hundred sixteen times three point one six is about a thousand, so it’s the same factor each way.
And twenty sits only three tenths of the way from ten to a hundred, because the log of two is zero point three. And always read the labels first, because a famous semi-log chart, seen more than twelve million times online, has a factor of a hundred between gridlines, not ten. Now we’re ready, so let’s fly back to Chile and read the star.
The element in the light
Here’s the star’s light on an ordinary ruler again. There’s the spike in the first months, and then that long flat tail. Now let’s switch the brightness to a log ruler. And there it is. From about day one hundred thirty to past day four hundred, the fading is a straight line going down.
A straight line going down means the light lost the same fraction of itself every single day, which is exactly how a radioactive element decays. Now let’s measure that line. Drag the two ends of the straightedge. Line it up with the straight part of the fading.
The light falls one whole grid line, a factor of ten, about every two hundred forty days, so the slope is about negative zero point four one per hundred days. And we can turn that into a half-life. Halving is a drop of zero point three on the log scale, three tenths of a gridline, so it takes three tenths of that time, which means the light halves about every seventy-three days.
So which element was it? Which one kept the star lit? So let’s fly out there, about a hundred and sixty thousand light-years. The explosion made a huge amount of nickel-56, about seven percent of the Sun’s mass, enough for twenty-three thousand Earths. Within weeks the nickel turned into cobalt, and for the next two years the cobalt turned into iron, and every one of those decays gave off a flash of energy that kept the cloud glowing.
Explosions like this one made about half the iron in your blood, long before the Sun was born, so you’ve been carrying a bit of this story your whole life. And after about day five hundred, the dots slip below the cobalt line. The cloud has thinned out, so some of the cobalt’s energy escapes into space, and later on, something slower takes over. Years later, the Hubble telescope photographed glowing rings around the explosion, and astronomers are still watching it.
On the exam
Let’s finish with the kind of question the exam asks. These data lie on a straight line on a semi-log plot. At x equals zero the value is fifty, and at x equals six it’s three thousand two hundred. Which function models these data? That’s exactly how the exam asks it, and notice that you didn’t need a calculator.
So let’s put the whole lesson on one board. On a log y-axis, exponential data make a straight line, rising for growth and falling for decay. The slope of that line is log b, and its starting height is log a. Undo the logs, and you get b and a back. If only the tail is straight, for large inputs, a shifted exponential still fits, with nothing to subtract first.
And before you read any slope, read the axis, because the space between gridlines stands for a ratio. In one big study, more than half the adults shown a chart with a log axis got a basic question about it wrong, and you just used one to read the name of an element, written across the sky by an exploding star.