
Topic 1.1 key terms
- function
- A relation that maps each input value to exactly one output value.
- independent variable
- The variable that represents the input values (here, time).
- dependent variable
- The variable that represents the output values (here, height).
- domain
- The set of input values of a function.
- range
- The set of output values of a function.
- image
- The single output value a function yields for a given input value.
- preimage
- The set of all input values for which the function yields a given output value.
- equal functions
- Two functions with the same domain that give the same output for every input in it.
- increasing on an interval
- For all a and b in the interval, if a < b then f(a) < f(b).
- decreasing on an interval
- For all a and b in the interval, if a < b then f(a) > f(b).
- concave down
- The graph is concave down on intervals where the rate of change is decreasing.
- concave up
- The graph is concave up on intervals where the rate of change is increasing.
- zero of a function
- An input value where the output is zero; the graph meets the horizontal axis there.
Transcript
2,796 words · 9 parts
Ninety meters up
You’re in the front seat of a roller coaster, climbing to ninety meters. The chain that’s been dragging you up this hill for the last half minute is about to let you go. There goes your stomach!
At the bottom of the drop, you’re squashed into your seat, which pushes up on you with almost four times your weight. A few seconds later, over the top of the next hill, the seat stops pushing on you altogether, and you float. Riders call that feeling airtime, and every float and every squash on this ride is written into one curve, the train’s height plotted against time, as long as you know how to read the way it bends.
So here’s my promise. By the end of this lesson, you’ll be able to read the graph of a ride. Even a ride you’ve never been on. You’ll point to every moment your stomach is going to drop. And you’ll do it before you even get in line.
To get there, we need words for how a change can speed up or slow down. The clearest place I know to see that is a lot calmer than a roller coaster, a martini glass filling from a tap.
Eight seconds to the brim
Our tap fills this one to the brim in exactly eight seconds. It pours the same amount of water into it every single second. I’m going to empty it and draw a line halfway up, because this glass is hiding a real surprise. The same steady pour fills the whole glass in eight seconds. So how long do you think the water will take to reach that halfway line?
We’ll pour it at the real speed, so keep your eyes on the clock, because this part happens fast. One second, and the water is already at the line! The other seven seconds all go into the top half, and you can watch the water slow down more and more as the glass gets wider.
So why is the bottom half so quick? When the water reaches the line, it’s a little martini glass of its own, half as tall as the big one, half as wide from left to right, and half as wide from front to back. Half times half times half is one eighth, so the bottom half holds just an eighth of the water, and at a steady pour that takes an eighth of the eight seconds, which is one second.
Same water, different rises
Let’s paint each second’s water its own color. The tap adds the same twenty-six milliliters every second, which means every band holds the same amount of water. The first band is four centimeters thick, because the bottom of the glass is so narrow, and every band after it is thinner, since the same water has to spread across a wider and wider glass. Now I’m going to lift each band out of the glass and stand it on the graph, right above the second it was poured in, and watch what they build, because they stack up into a staircase that climbs the curve, one big four-centimeter step and then smaller and smaller ones.
Here’s the same graph on the board, with every band standing over its own second. Height and time change together, or in tandem, and since every later time comes with a greater height, the height is increasing the whole way. But the rises keep shrinking, from four to about one to about three quarters. The height is climbing more and more slowly, which means its rate of change, the height gained per second, is decreasing.
When the rate of change is decreasing, the graph bends downward like this, and we call that concave down, which is one of the most important words in this whole course. Hold on to that word. It’s also the secret behind what your stomach did on that coaster. And notice that the graph doesn’t look like the glass at all. The glass is shaped like a V, but the graph pairs every moment with the height of the water, and that gives one curve that shoots up and then climbs more and more slowly.
Change the glass, change the graph
Teachers have been using glasses like these for more than forty years to teach people to read curves, so let’s do what they do and change the glass. A cylinder is the same width all the way up, so every second’s water makes a band of the same thickness, and the graph comes out as a straight line.
This one is shaped like a lab flask, and it does the opposite of the martini glass, because it gets narrower toward the top, so the bands get thicker as the water climbs, and the rate of change is increasing. When the rate of change is increasing, the graph bends upward, and that’s called concave up. Here’s a fishbowl, narrow at the bottom, widest around the middle and narrower again near the opening. When researchers gave twenty calculus students with top grades a round bottle like this one, only five of them drew its graph correctly.
Here’s your chance to do better than they did. Go ahead and sketch, right on the graph, how you think its water level will rise as it fills. Then we’ll pour it and see how close you got.
Here comes the pour, so you can check your curve against the water, which races through the narrow bottom, crawls past the widest part and speeds up near the top, and that makes the graph concave down and then concave up. Now let’s turn the problem around and start from a graph. Watch the graph as I pull the bottom of this glass outward, and you’ll see its start get flatter, because a wide bottom fills slowly.
This time you’re the glassmaker, so grab the purple handles on the side of the glass and drag them in or out until its water would rise like this dashed graph, slow at first, then fast in the middle, then slow again at the end. This graph needs an hourglass, wide at the bottom, narrow in the middle and wide again at the top, because a slow climb means a wide glass and a fast climb means a narrow one.
One input, one output
Let’s give all of this the names the AP exam uses. Every glass sets up a rule, where you put in a time and out comes a height. A rule like that is called a function when every input value gives you exactly one output value, and the glass makes that easy to believe, because at any single moment the water has one height, never two.
Time is the input, which we also call the independent variable, and height is the output, the dependent variable, since the height depends on how long we’ve been pouring. The same function comes in several forms. In words, it’s the height of the water in our martini glass after t seconds of steady pouring, and as a formula, it’s h of t equals four times the cube root of t.
As a table, each row pairs one input with its one output. One second gives four centimeters, and eight seconds gives eight. As a graph, every row becomes a point, so the graph is the whole set of input-output pairs at once. The inputs that make sense here run from zero to eight seconds, and we call that set the domain. The outputs run from zero to eight centimeters, and that set is the range.
There are two more words you’ll need. The image of an input is the single output it gives you, so the image of one second is four centimeters. Going the other way, the preimage of an output is the set of all the inputs that give you that output. The water is six centimeters deep at three and three eighths seconds, so the preimage of six is just that one time.
Find the time when the water is exactly five centimeters deep. That’s the preimage of five. Give it to the nearest hundredth of a second.
Dividing both sides by four leaves the cube root of t equal to five fourths, and cubing both sides gives one hundred twenty-five over sixty-four, about one point nine five seconds. The formula doesn’t know about the glass, though, and at ten seconds it happily gives about eight point six centimeters, when the real water would be spilling over the rim.
That’s why two functions are equal only when they have the same domain and the same output for every input. The formula on all real numbers and our glass from zero to eight share a rule, but they aren’t equal functions. So far, every glass has given us a graph. And every one of them only goes up.
The water wheel
Let’s go somewhere the water does the work, a wooden mill wheel six meters across, turning slowly in a stream. Keep your eye on the orange bucket, because its little lamp is going to draw the bucket’s path while the wheel makes one full turn. Here it comes, up out of the water and climbing the near side. Leveling off as it rolls over the top. And then dropping down the far side, and back into the stream.
This next part is my favorite, because we’re going to keep every height exactly where it is and just slide the moments apart in time, and look, the circle of light unrolls into a wave, and that wave is the graph of the bucket’s height. The water line is our time axis, so whenever the bucket is under water, its height is negative.
Going up, its height is increasing, and coming down, it’s decreasing, with the highest point at the top of the wheel, five point six meters up, and the lowest at the bottom, forty centimeters under water. The bucket breaks the surface twice, coming out at one second and going back in at eleven, and its height is exactly zero there. Those two inputs are the zeros of the function, right where the curve crosses the time axis. Now let’s ask the wheel a backwards question, the kind the preimage asks. At three seconds the bucket is level with the axle, two point six meters above the water, on its way up.
Is that the only moment in the turn when the bucket is two point six meters up? Or does it come back to this height later on, and if so, when?
So the bucket is two point six meters up twice in every turn, once at three seconds on the way up and again at nine seconds on the way down, which means one output comes from two different inputs. That’s exactly why a preimage is a set, because in the glass the water only went up and passed six centimeters once, but the bucket comes back down, so the preimage of two point six holds both times, three and nine.
The very top is different, because the bucket gets there only once in a turn, at six seconds, so the preimage of five point six holds just one input. You can tell which way this curve bends just by looking at the wheel, because whenever the bucket is in the bottom half the curve bends upward, and in the top half it bends downward, so the bend switches every time the bucket passes the axle.
I’m handing the wheel over to you now. Drag the orange bucket around to the exact spot where you think it’s rising the fastest, and let go there. Level with the axle, the bucket rises a little over one and a half meters every second, which is as fast as it ever climbs, and up at the very top it’s moving sideways, so for that one instant its height isn’t changing at all.
Up, down, and the bend
Let’s pin down exactly what increasing means. A function is increasing on an interval if, as the input values increase, the output values always increase. In symbols, for all a and b in the interval, if a is less than b, then f of a is less than f of b. The bucket’s height is increasing from zero to six seconds, because any two times you pick in there, like two and five, the later one always comes with the greater height.
Decreasing is the mirror image, so for all a less than b, f of a is greater than f of b, and the bucket’s height is decreasing from six to twelve seconds. And notice the word always in that definition, because it’s doing real work, and it’s exactly the kind of word the AP exam likes to test.
The bucket is about one point one meters up at two seconds and two point six meters up at nine. Is its height increasing on the interval from two to nine seconds? From two seconds to nine the bucket does end higher than it started, but its height isn’t increasing there, since it goes over the top in between, and every pair of times has to go up, not only the two ends.
As the bucket comes up from the bottom, it rises forty centimeters in the first second, then a meter ten, then a meter and a half, which means the rate of change is increasing and the curve is concave up. Over the top half, the rises shrink and then turn into bigger and bigger drops, so the rate of change is decreasing and the curve is concave down from three seconds to nine.
Put the two questions together, which way it’s heading and which way it bends, and one turn of the wheel gives you all four combinations, one in each quarter of the wheel. Look at the bottom left. From nine to twelve seconds the bucket is falling, yet the curve is concave up, because its drops keep getting smaller. Concave up only tells you the rate of change is increasing.
On the exam
Here’s a question in real AP style. A phone was plugged in for an hour, and this table shows its battery level, P of t, every fifteen minutes. It starts at ten percent and reaches eighty-six after an hour.
Look at the table one more time. Which of these statements is consistent with it? On the exam, cite the numbers first and then name the property. Over equal fifteen-minute intervals P gains twenty-eight percentage points, that’s thirty-eight minus ten, then twenty-two, sixteen and ten, so the average rate of change of P is decreasing, and the graph of P is concave down.
Read the ride
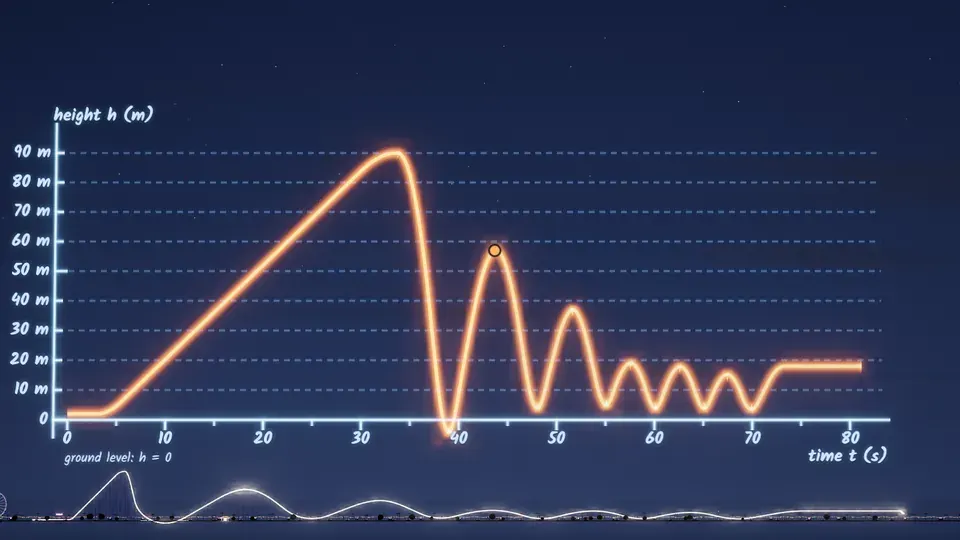
Let’s go back to the coaster and keep that promise. It’s night now, and this is the graph of the whole ride, from the station to the brakes, and most of it is track you haven’t ridden yet.
We’ll read it the way we read the glasses, one stretch at a time. The long straight climb is the lift hill, a steady rate, so you feel your normal weight. Then the curve bends over the top and plunges, concave down, right where your stomach dropped.
Now find the next one yourself. Drag the rider along the graph. Park it at a moment later in the ride where you think your stomach will drop again.
Let’s ride it and check. Every time the graph bends downward, the meter drops and you get lighter, and over the sharpest crests it drops to zero, or even below, and you float. That’s no coincidence, because concave down means your upward speed is shrinking or your downward speed is growing, and that can only happen when the seat pushes up on you with less than your weight.
And wherever the graph bends upward, at the bottom of every valley, the seat pushes harder than your weight and squashes you into it, even while the train is still heading down. You’ve felt both of these in an elevator. As it starts down, you feel a little lighter. Then it slows to a stop. And you feel a little heavier.
Just like the glass, the graph isn’t a picture of the track either. The lift hill is short and steep on the track, but it’s long and gentle on the graph, because it takes half a minute.
Everything from today is on this one curve. The train has one height at every moment, so its height is a function of time, increasing up the lift hill to its maximum, with zeros where it dives into the tunnel and back out. So far we’ve described rates of change with words like faster and slower, and in the next lesson we’ll put an actual number on them and work out how fast a real rocket is climbing at one single instant.