
Topic 1.9 key terms
- vertical asymptote
- A vertical line x = a near which the outputs of r increase or decrease without bound as x approaches a from the left or the right. For a rational function it happens where the bottom is zero and has more copies of (x − a) than the top.
- increases without bound
- The outputs become greater than any number you name; written as a limit equal to ∞. The function never reaches a value called infinity.
- decreases without bound
- The outputs become less than any number you name; written as a limit equal to −∞.
- one-sided limit
- x → a⁺ uses inputs near a and greater than a (the right side); x → a⁻ uses inputs near a and less than a (the left side).
- multiplicity
- How many times a factor (x − a) appears. A vertical asymptote occurs at x = a when a has greater multiplicity in the bottom than in the top; a tie or a bigger count on top leaves a hole.
Transcript
2,915 words · 9 parts
Doomsday
This is the night side of our planet. We’re going to light it up with people, starting two thousand years ago, when the whole world held just a few hundred million of us. For sixteen centuries the lights grow slowly. Then they take off, with one billion people around eighteen hundred, two billion by nineteen twenty-seven and three billion by nineteen sixty.
And in nineteen sixty, three scientists published a paper in Science, one of the most famous journals in the world, and they called it Doomsday, Friday the thirteenth of November, twenty twenty-six. Their formula said the number of people on Earth would shoot off to infinity in November twenty twenty-six, give or take five and a half years, and right in the middle of that window they picked a Friday the thirteenth.
And they wrote, with a perfectly straight face, that our great-great-grandchildren will not starve. They will be squeezed to death. By the end of this lesson, you’ll be able to find that date yourself from their formula in about ten seconds, say exactly what the formula does as we close in on it, and the morning after, and know why we’re all still here. So let’s look at the formula they found, because the whole story hides inside one fraction.
Years left
They started with estimates of the world’s population going back two thousand years, these pink dots, and they went looking for one formula that would run through all of them. This is the curve they found, and its formula, slightly rounded, is N equals one hundred eighty over two thousand twenty-six point eight seven minus t, where N is the number of people in billions and t is the year.
Look closely at the bottom of that fraction, because it’s the number of years left until two thousand twenty-six point eight seven, so let’s just call it the years left. Here’s your first job, and you can do it in your head. At what value of t does this formula break down?
So the formula has a wall, a line standing straight up at two thousand twenty-six point eight seven where it has nothing to say, and mathematicians call a line like that a vertical asymptote, which is what this whole lesson is about. Now let’s watch the number of people as we close in on that wall. With ten years left, back in November twenty sixteen, the formula says eighteen billion people.
With one year left, it says a hundred and eighty billion, and with a tenth of a year left, about five weeks before doomsday, it says one point eight trillion. A hundredth of a year is about three and a half days, and by then the formula says eighteen trillion people, and the curve just keeps climbing up into the stars. Do you see the pattern? Every time the years left shrink ten times, the people grow ten times, because we keep dividing the same one hundred eighty by a number that’s ten times smaller.
Here’s the same curve. And here are the numbers we just watched. The years left are on one side, and the people are on the other. Read down the columns and it’s the same pattern we saw from space, a tenth of the years left means ten times the people. The bottom gets as close to zero as you like, so N grows past any number you can name, and we say N increases without bound, right next to the wall, where the bottom is zero.
Dividing by almost nothing
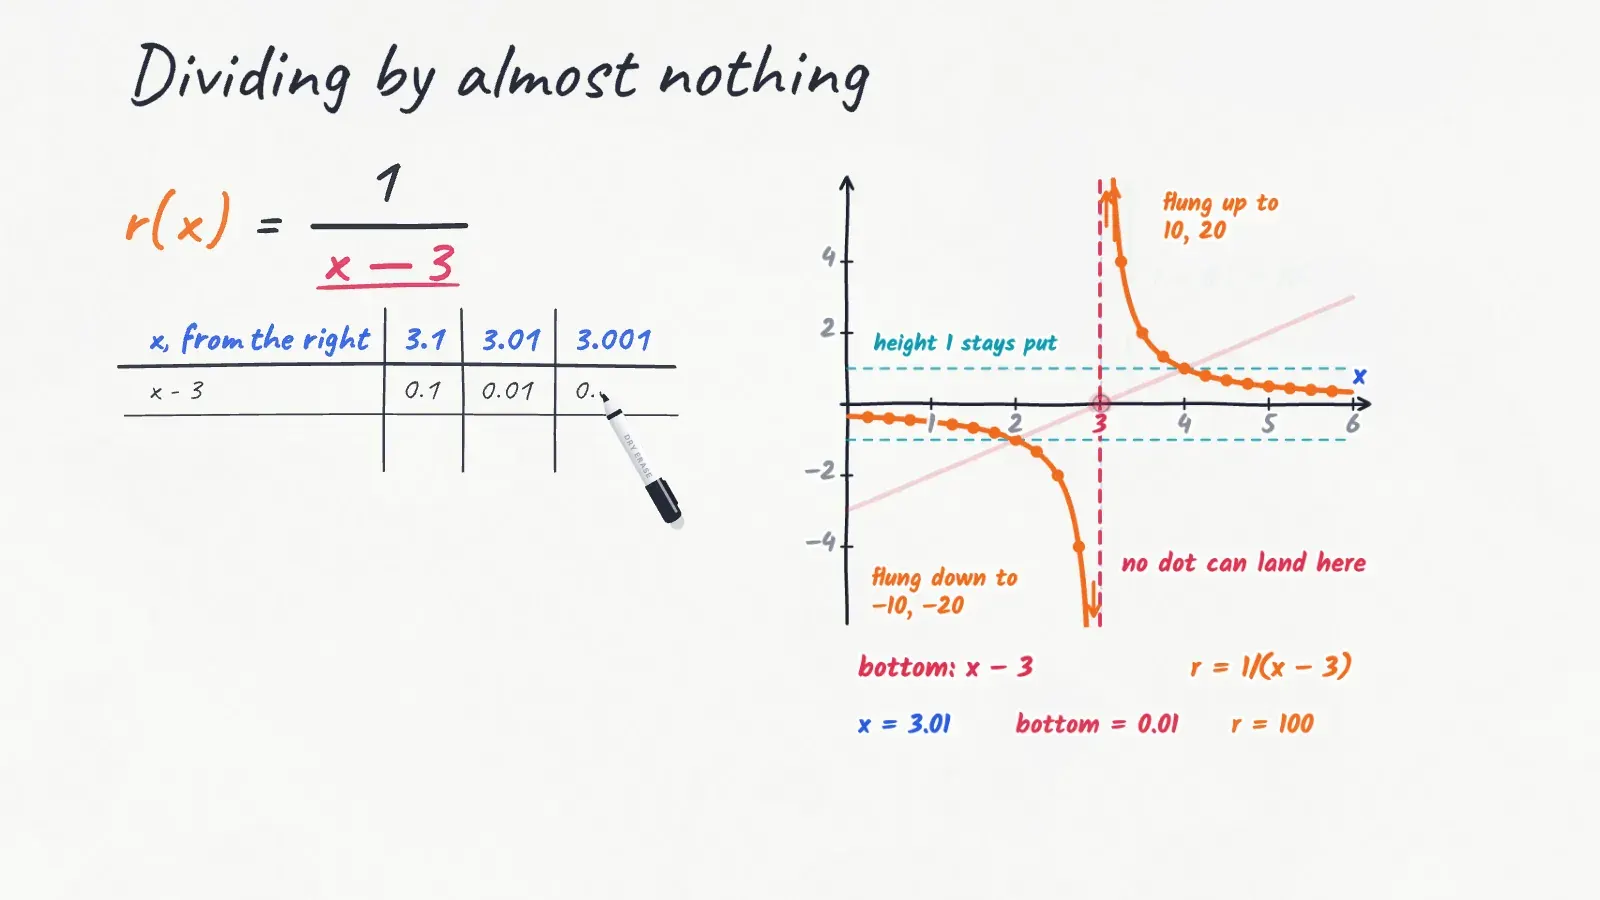
Let’s strip the story away and look at a really simple function with a wall, r of x equals one over x minus three. Its bottom is zero at three and its top is never zero, so we expect a wall at x equals three.
You might be thinking that one over zero is just infinity, so what’s the big deal? But if one over zero were a number called infinity, two over zero would be that same number, and multiplying both by zero would prove that one equals two. So one over zero has no answer at all, and the interesting question is what happens right next to zero.
Let’s divide by almost zero instead. Here’s the bottom, x minus three, drawn as a red line, and each dot sits at the height of the bottom for its x. In a moment every dot is going to jump to one over its height. A dot at height one stays exactly where it is, because one over one is one, and a dot at height one half jumps up to two.
Before I flip them, I want your prediction. What happens to the dots right next to x equals three, where the red line is almost touching zero?
Let’s flip them. The dots near three get flung right off the board, the ones on the right shoot up and the ones on the left shoot down, because they started below the axis and the minus sign comes along for the ride. And the dot at exactly three has height zero, so it has nowhere to land at all. Nothing can ever land on this line, and that’s the vertical asymptote.
From the right, at three point one, the bottom is a tenth, so r is ten, at three point oh one it’s a hundred, and at three point oh oh one it’s a thousand, so ten times closer, ten times bigger, just like doomsday. We write that as the limit, as x approaches three from the right, of r of x, equals infinity. That little plus sign means from the right, with inputs bigger than three.
And equals infinity doesn’t mean r ever reaches a number called infinity. It’s shorthand for r increases without bound, which means it keeps growing past any number you can name. From the left, at two point nine, the bottom is negative one tenth, so r is negative ten, then negative a hundred, then negative a thousand, so the limit from the left, with a little minus sign, is negative infinity, and r decreases without bound.
So at x equals three there are really three facts. People mix them up all the time. The function r has no value at three, there’s no single limit at three because the sides disagree, and there are two one-sided limits, each telling you what the graph does on its own side, negative infinity on the left and infinity on the right.
The morning after
Now let’s go back to doomsday. So far, we’ve only looked at one side of that wall. Let’s look at the other side. Our slightly rounded formula doesn’t stop at two thousand twenty-six point eight seven. What does it say for three and a half days after doomsday?
Minus eighteen trillion people. Three and a half days after doomsday, the formula says the Earth is home to minus eighteen trillion of us. So on the left of the wall the people increase without bound, and on the right they decrease without bound. The limit from the left is infinity, and the limit from the right is negative infinity.
That’s the opposite of one over x minus three, where the left went down and the right went up, so never assume which way a side goes, read it from the signs. And nobody believes in negative people, which is a big hint about how this story ends.
The keeper’s lens
Doomsday’s right side is nonsense, so let’s find a wall where both sides mean something. This is the lantern room at the top of a lighthouse, and that huge beehive of glass is its lens, taller than a person.
A lens gathers the light from the flame into a picture of the flame. Where that picture lands depends on how far the flame sits from the lens. This lens has one special spot, ninety-two centimeters out, called the focal point, and I’ve marked it in red. With the flame a little beyond the focal point, its picture forms out in the mist about four meters from the lens, and look at it, it’s upside down.
Let’s slide the flame toward the red mark. With eight and a half millimeters to go, the picture lands a hundred meters out to sea, with less than a millimeter it’s a kilometer out, and with less than a tenth of a millimeter, ten kilometers. It’s the doomsday table all over again. Ten times closer to the red mark, ten times farther out to sea, because the gap between the flame and the focal point sits on the bottom of the formula for where the picture lands.
Now I want you to be the keeper. There’s a ship out on the horizon, twenty nautical miles away, which is about thirty-seven kilometers, so slide the flame until its picture lands right on the ship.
Now watch what happens when the flame slips past the red mark. The light leaves the lens spreading out, so the picture appears behind the flame, back over the land, the right way up, and it grows as we creep back toward the mark. So this wall has two sides that both mean something. From the far side the picture races out to sea, upside down, and from the near side it races off behind the flame, the right way up.
So the limit from the right, with the flame farther out than ninety-two centimeters, is infinity, the limit from the left is negative infinity, and the sign of the formula tells you which way up the picture is. And I love this part. At exactly the focal point the formula has no value at all, and that’s where every classic lighthouse puts its flame, because then the light leaves the lens as one straight beam that can carry twenty nautical miles.
Crossing or touching
Every wall we’ve seen so far comes from a bottom shrinking to zero, and every one of them had its two sides going opposite ways, one up and one down. So is that always true? Here’s a new bottom, x minus three, squared, and it’s a parabola that touches zero at three but never goes below the axis, because a square can’t be negative. Now I’m going to flip these dots. Which way do the two branches go?
Let’s flip. Every dot lands above the axis, and the ones near three fly up on both sides of the wall, so the limit from the left and the limit from the right are both infinity.
So when the bottom crosses zero, like x minus three, the sides go opposite ways, and when it only touches zero, like x minus three squared, they go the same way, and that’s the difference between an odd power and an even power. One catch: cancel any factor the top shares first. We’ll do that in a minute. And the top gets a vote too. Put a minus sign on top, and the flip sends every dot down instead, so both sides decrease without bound.
Not every zero is a wall
So far every zero of the bottom gave us a wall, but here’s a function where that breaks. Its bottom is zero at x equals two and at x equals five. At five, the top is three times six, which is eighteen and not zero, so we get a wall there, just like before.
But at two the top is zero too, the factor x minus two cancels, and near two the function is just x plus one over x minus five, which is close to negative one. So there’s no wall at two, only a single missing point called a hole, and holes are next lesson’s story.
There’s a popular shortcut: cross out any factor on both the top and the bottom, and the wall is gone. It worked here, so let’s test it on x minus two over x minus two, squared.
The shortcut says there’s a hole at two, but when we cancel, one copy of x minus two is still on the bottom, so the function is really one over x minus two, which has a wall at two, so the shortcut just failed. So instead of crossing things out, count the copies. For a wall at a, the bottom needs more copies of x minus a than the top.
One copy on top and one on the bottom is a tie, and a tie makes a hole. Two on the bottom and one on top means the bottom wins, and that’s a wall. And when the top wins, the extra copy stays on top. x minus two, squared, over x minus two is just x minus two, with a hole at two.
And x over x squared plus four has no wall anywhere, because x squared plus four is always at least four, so the bottom is never zero. Look at these four functions. Which one has a vertical asymptote at x equals two?
Hunting walls, exam style
Let’s hunt down every wall of one function from start to finish, the way the exam expects you to, with r of x equals x plus one over x squared minus four x. First I factor the bottom, because its factors tell us where the walls might be, and x squared minus four x is x times x minus four. So the bottom is zero at zero and at four, the top is zero only at negative one, and we get two walls, x equals zero and x equals four.
Now which way does each side go? Near four the top is about five and the x on the bottom is about four, both positive, and x minus four is tiny, positive just right of four and negative just left of it. Just right of four that’s a positive over a tiny positive, so r shoots up to infinity, and just left of four it’s a positive over a tiny negative, so r plunges to negative infinity.
At zero the same kind of check gives the opposite pattern, up on the left and down on the right, because there it’s the factor x that changes sign. Just left of zero, x is a tiny negative and x minus four is negative, so the bottom is a negative times a negative, a tiny positive, and r shoots up, and just right of zero the bottom is a tiny negative, so r plunges.
And the graph agrees with all four. Both walls are crossings, odd powers, so at each one the two sides go opposite ways, just like the flip told us they would. In limit notation, near zero the left side goes to infinity and the right side to negative infinity, and near four it’s the other way round, negative infinity on the left and infinity on the right.
This is exactly how the exam likes to ask it, with no formula at all, just a table of values near a point. Here’s a brand-new function r, with its values just below two and just above two. Which statement is consistent with this table?
The exam also wants you to say it in words, so here’s doomsday’s wall in one sentence, and it’s the kind of sentence that earns the point. As t approaches two thousand twenty-six point eight seven from the left, N of t increases without bound, so the graph of N has a vertical asymptote at t equals two thousand twenty-six point eight seven. It names the side, it says what the output does, and it ties that to the wall. Those three pieces are exactly what a grader is looking for.
Why we’re still here
So let’s go back to the biggest question of all, which is why we’re still here. Their formula fit two thousand years of data, and then the real world kept counting. For about thirty-five years the real numbers stay close to the curve, they cross it around nineteen ninety-six, and then they peel away. On New Year’s Day twenty twenty-six the formula said two hundred and seven billion people, and the real number was a little over eight billion. What changed was the growth itself.
For the formula to work, the growth rate has to keep climbing toward its own wall, but in the real world the growth rate peaked around nineteen sixty-three, just after the paper came out, and it’s been falling ever since. So when a model runs into a vertical asymptote, the wall is a warning. Something in the real world has to change before it gets there, and here, it did.
Let’s put the whole lesson on one board, in five lines. A wall at x equals a needs the bottom to be zero at a. It also needs more copies of x minus a on the bottom than on the top. Near the wall the bottom gets arbitrarily close to zero, so the output increases or decreases without bound.
We say which way with one-sided limits, a plus for the right side and a minus for the left. After you cancel, when what’s left on the bottom crosses zero, the sides go opposite ways. When it only touches zero, they go the same way. And in a model, a wall is a warning.
You found doomsday in about ten seconds, you can say exactly what the formula does on both sides of it, and now you know why we’re all still here. Next time, we’ll meet the zeros on the bottom that don’t make a wall at all. They’re called holes.