
Topic 1.14 key terms
- function model
- A function built from what is known about a situation (restrictions, a shape, data, a proportionality) and used to answer questions about it, with units.
- restriction
- A condition from the context or the mathematics that the model must satisfy, such as "speed zero at the pad", h(0) = 4,500, or a domain from ignition to touchdown.
- vertex
- The turning point of a parabola, where the graph is flat. For the landing booster, the vertex is the moment its speed reaches zero, which must be on the pad.
- transformation of a parent function
- Building a model by shifting and stretching a parent such as t²: h(t) = a(t − 30)² is t² slid 30 to the right and stretched by a.
- parameter
- A constant in a model, such as a in a(t − 30)², d in 45,000/d, or k in k/r², pinned down by the facts.
- piecewise-defined function
- A function made of different rules on different intervals of the input; in a model, the pieces must meet where they join.
- regression
- Using technology to find the model of a chosen type (linear, quadratic, cubic, quartic, …) that fits data with the smallest total squared miss. The context picks the type; R² only compares fits.
- inversely proportional
- y is inversely proportional to x when y = k/x (their product is constant), and to the square of x when y = k/x². Both are rational function models.
- system of equations
- One equation per known fact, solved together to find the parameters. A quadratic needs three facts.
- average rate of change
- Over [a, b], (f(b) − f(a))/(b − a), in output units per input unit. Interpret it with the interval, the words "on average", the value, its direction and its units.
Transcript
2,880 words · 7 parts
One burn left
It’s a few minutes after sunset at Cape Canaveral, and if you look way up, there’s a star up there that’s moving, and it’s getting brighter. That’s no star. It’s the first stage of a Falcon 9 rocket, almost fifty meters tall, and a few minutes ago it pushed a spacecraft toward orbit, and now it’s coming home, tail first, at about a thousand kilometers an hour.
Watch the last thirty seconds closely, because the whole landing depends on one decision the booster makes on the way down. And it’s down. It’s standing on a landing pad, a few miles from where it took off. It’s ready to fly again. So let’s rewind it to nine kilometers up, because there’s a catch that makes this much harder than it looks, and the catch is that this booster can’t hover.
Even with one engine turned all the way down, its flame pushes harder than the nearly empty booster weighs, so once it lights, it slows down, stops for an instant, and then starts climbing again. That means it gets exactly one try, because if it lights too late, it’s still moving fast when it reaches the ground, and if it lights too early, it stops a kilometer and a half up in the air, with nothing underneath it. Then it’s a rocket again, heading the wrong way.
SpaceX learned all of this the expensive way. They even put out a blooper reel of their crashed landings, set to a brass-band march. It’s worth looking up after this lesson. By the end of this lesson, you’ll be able to tell a falling booster the exact moment to light its engine. And then, you’ll land one yourself, on a ship in the middle of the ocean, at night.
So before we do any math, I want your gut feeling. It’s falling at three hundred meters a second, and once its engine lights, it loses ten meters a second of speed every second, so how high up do you think it should light?
Three facts, one function
Let’s work it out properly, the way you build any model, by writing down everything we actually know. First, when the engine lights, the booster is falling at three hundred meters a second. Second, the engine takes ten meters a second off that speed, every second, for as long as it burns.
And third, the one that makes it a landing. Its speed has to hit zero at the exact moment it reaches the pad. Each of those facts is a restriction. It’s a rule our model has to obey.
Let’s start with the speed. It starts at three hundred, and every second it drops by ten, so two ninety, two eighty, two seventy, and so on. Losing the same amount every second makes the speed a linear function of time, v of t equals three hundred minus ten t, with t in seconds since the engine lit.
Fact three asks when that speed hits zero, which is when ten t is three hundred, so after thirty seconds, and that’s how long the burn lasts. So how far does it fall in those thirty seconds? Because the speed drops at a steady rate, its average is right in the middle, a hundred fifty meters per second, since the fast half and the slow half balance out.
One second in, it’s doing two ninety, and one second before the end it’s doing ten, and those two average to a hundred fifty, and so does every pair like them. And a hundred fifty meters every second for thirty seconds is four thousand five hundred meters, so it has to light four and a half kilometers up. How close was your guess?
Now let’s watch the altitude during those thirty seconds, because the shape it draws is the whole lesson. It drops a long way at first, and then less, and less. And look at how it touches down. The curve comes in flat, right on the ground, because at that instant the booster isn’t moving at all.
When the speed drops at a steady rate, the altitude always draws this shape, a parabola, and the flat point where it turns is called the vertex, so a perfect landing is a parabola whose vertex sits exactly on the pad. And that’s what went wrong for our ghosts. The early one hit its vertex in mid-air, and the late one hit the ground still steep. So let’s build that parabola’s equation, starting from the simplest parabola there is.
Here’s y equals t squared, with its vertex at the origin, and ours needs its vertex at thirty seconds, so we’ll slide it thirty to the right. Sliding right by thirty means writing t minus thirty inside the square, and even though the minus looks like it goes left, the inside is zero at t equals thirty, so that’s where the vertex lands.
That puts the vertex in place, but not the steepness. So let’s put a number a in front for the stretch. Then we’ll use one more fact to pin it down. We know where it starts, four thousand five hundred meters up at t equals zero. Putting zero in for t leaves a times nine hundred, which has to equal four thousand five hundred, so a is five.
So during the burn, the altitude is h of t equals five times t minus thirty squared, from the moment the engine lights to touchdown at thirty seconds. Let’s make sure it behaves. Ten seconds in, it gives five times four hundred, two thousand meters, and at twenty seconds it’s down to five hundred, which is exactly the slowing down we watched. Notice how the facts did all the work. Being on the pad and stopped there put the vertex at thirty, zero, and the starting height fixed the stretch.
Okay, now you try one. A smaller booster comes in at two hundred meters a second, with the same ten meters a second of braking, so which function models its altitude during the burn?
Where the pieces meet
Now let’s zoom out, because before the engine lights, the booster has already been falling for a while at a steady three hundred meters a second, and on a graph, a steady speed is a straight line. So the whole trip down from nine kilometers is two rules glued together, a line while it falls and a parabola while it slows to a stop, and a function made of pieces like that is called piecewise-defined.
Changing when it lights never changes the parabola’s shape, because the engine always slows it down the same way, so lighting earlier, at six kilometers, just slides it up the line, and its vertex ends up a kilometer and a half above the pad. Light it later, at three kilometers, and the same parabola slides down until its vertex is underground, so the booster reaches the pad still doing more than six hundred kilometers an hour.
So now it’s your turn to fly it. Drag the ignition point along the falling line until the parabola touches the pad right at its vertex, and then let go and watch what happens.
Let’s write down what you just found. We’re counting from when it passes nine kilometers, and at three hundred a second it takes fifteen seconds to fall to forty-five hundred meters, so the burn starts at fifteen seconds and lasts thirty, which puts touchdown at fifteen plus thirty, forty-five seconds. So the line is nine thousand minus three hundred t, up to fifteen seconds, and the parabola has its vertex at forty-five, five times t minus forty-five squared, from fifteen to touchdown.
And look, the two pieces meet right where the engine lights. Put fifteen into the line and you get forty-five hundred, put fifteen into the parabola and you also get forty-five hundred. They have to meet, because a booster can’t jump from one height to another, and on the AP exam, making the pieces meet is usually how you find a missing number in a piecewise model.
The real thing
Our booster has had nice round numbers, so let’s check a real one. On August fourteenth, 2017, a booster landed on this same pad after sending a cargo Dragon toward the Space Station. Here’s its altitude from SpaceX’s webcast, every four seconds from the moment its engine lit, eight readings from thirty-eight hundred meters down to zero.
Let’s put them in a table. Here’s the time in seconds since ignition, next to the altitude in meters. Read down the altitude column, and look at how much it drops each time. If this were a line, it would drop the same amount every four seconds, but from thirty-eight hundred to twenty-eight hundred it drops a thousand, then nine hundred, then seven hundred, and the drops keep shrinking.
The changes in those drops hover around a hundred fifty each time, bouncing between a hundred and two hundred because the webcast rounds to the nearest hundred meters. You saw in lesson one point three that steady second differences are the fingerprint of a quadratic.
A calculator can also find the best curve for us, which is called a regression. A linear regression gives this line, with an R squared of point nine two, on a scale where one is a perfect fit, which sounds great. But look where the line goes. It reaches the ground at twenty-four seconds and keeps right on going, so by twenty-eight seconds this model has the booster half a kilometer underground.
A quadratic regression runs almost exactly through the readings, with an R squared of point nine nine nine eight, and its vertex is at about twenty-seven and a half seconds and just sixteen meters up, well inside the webcast’s rounding, so right at the pad. A cubic or a quartic regression scores a hair higher. But adding terms can never lower R squared, and here the extra terms change almost nothing. So if you were writing this up on an exam, which regression would you choose for this landing? And why?
Multiply out our five times t minus thirty squared, and the five stays in front of t squared. The calculator’s four point nine nine sits in that same spot, so it’s that curve’s a. Its units are meters per second squared, the units of braking. Our own booster braked at ten, and its a was five, half the braking.
Why half? The starting height is a times thirty squared. It’s also the average speed times the time, a hundred fifty times thirty. Divide both by thirty squared, and a is a hundred fifty over thirty, which is five.
A hundred fifty is half the speed, and the speed over the time is the braking. That makes a half the braking, for any steady burn. Double the real booster’s a, four point nine nine, and you get its braking, just under ten. That’s the nine point eight of gravity, about one g.
Brake harder
Not every booster can fly back to land, so when a rocket throws its payload high and fast, the booster lands on a ship instead, about six hundred fifty kilometers out at sea. It comes in with very little fuel left, so one night in May 2016, landing on a ship called Of Course I Still Love You, a booster lit three engines and braked about three times as hard. Look at how much lower it can wait. The whole burn is over in about ten seconds.
So let’s build a model for the ignition height that works for any braking d. The booster still takes three hundred over d seconds to stop, just as three hundred over ten gave us thirty, and its average speed is still a hundred fifty. So the height it needs is a hundred fifty times three hundred over d, which is forty-five thousand over d.
That’s a rational function, and one engine at ten gives our forty-five hundred meters, three engines at thirty give fifteen hundred, and every time you double the braking, the height you need is cut in half. When doubling one quantity always halves the other, we say they’re inversely proportional, and a function like k over d is how you model it.
Here’s every possible plan on one picture, with the braking across and the ignition height up, and the plans that land perfectly make exactly this curve. Pick a plan above the curve and the booster stops in mid-air, pick one below it and it hits the deck.
Now use the model backwards. A booster comes in at three hundred meters a second, lights at eighteen hundred meters and lands perfectly, so how hard was it braking?
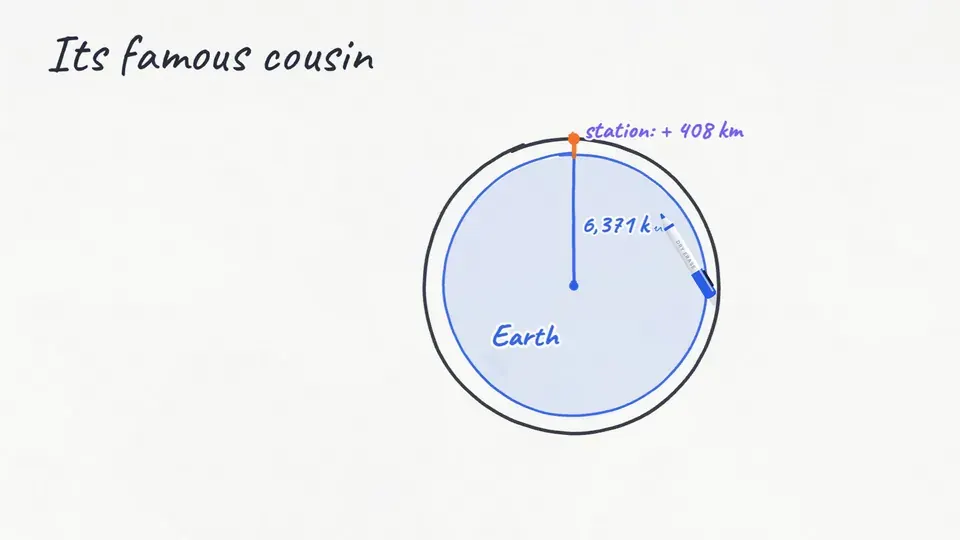
Inverse proportion has a famous cousin. That August booster’s Dragon was headed for the Space Station, about four hundred kilometers up, where astronauts float as if there were no gravity. Shrink the Earth to a basketball, and the station flies less than a centimeter above it. Gravity weakens with the square of your distance from Earth’s center. Twice as far, a quarter of the pull. Three times as far, a ninth.
At the surface, you’re sixty-four hundred kilometers from the center, and gravity is nine point eight. That one fact pins down k, nine point eight times sixty-four hundred squared. Careful: measure r from Earth’s center, not from the ground. The station is four hundred kilometers higher, so its r is sixty-eight hundred.
Put that k into k over r squared, with r at sixty-eight hundred. Sixty-four hundred over sixty-eight hundred is sixteen over seventeen. Square that and multiply by nine point eight. You get about eight point seven, almost ninety percent of what you feel right now.
Astronauts float because they and their station fall around the Earth together. The ground keeps curving away beneath them. Compare that with the braking. Doubling the braking halved the height. Doubling the distance cuts gravity to a quarter.
Your turn. A satellite flies sixty-four hundred kilometers above the ground. How strong is gravity up there?
Answer it like the exam
Now let’s do this the way the AP exam asks it, because the 2025 exam’s modeling question had these same three parts, a quadratic from three facts, a rate with units, and where the model stops working. Suppose you’re given just three of the August booster’s readings, at zero, twelve and twenty-four seconds, and asked for a quadratic, a x squared plus b x plus c.
Each reading gives one equation, and x equals zero wipes out everything but c, so c is thirty-eight hundred. Put the other two readings in, where twelve squared is a hundred forty-four and twenty-four squared is five seventy-six, and take thirty-eight hundred off both sides of each. Now double the first one, so both have twenty-four b, and subtract it from the second, and the b terms cancel out.
That leaves two eighty-eight a equals fifteen hundred, so a is about five point two oh eight. Put a back in, and a hundred forty-four a is exactly seven fifty, so b comes out near negative two seventy-nine.
So three readings give us this model, very close to the regression that used all eight. On the exam, write every decimal to three places, the way it’s written here. And past its vertex at about twenty-seven seconds, this parabola would have the booster climbing again, so this model stops working at its vertex, and that’s where its domain ends.
For the average rate of change over the first twelve seconds, it’s negative twenty-six hundred meters over twelve seconds, about negative two seventeen meters per second. When the exam asks you to interpret a rate, a number on its own isn’t enough. It doesn’t say what’s happening to the booster.
Now look at the four sentences. Which one correctly interprets that average rate? The full answer says that on average, from zero to twelve seconds after ignition, the booster’s altitude decreases by about two hundred seventeen meters per second.
It says it’s an average, over which interval, what’s changing, which way and by how much, and in what units, which is everything an interpretation needs. Over the next twelve seconds it’s only about ninety-two meters per second, so the rate of change is itself changing, which is the slowing down the burn is for.
Land it
So it’s time to keep the promise. Here’s a new booster coming down to the ship tonight, at three hundred sixty meters a second, and its three engines take thirty meters a second off its speed every second. You already know everything you need. You can build its model yourself.
So work out how high it has to light, set the ignition point there, and press LIGHT. Think about what went into that landing. Two restrictions, stopped and on the deck, put the vertex in place, and sliding t squared over to touchdown and stretching it gave the model its equation.
Real readings and a regression showed the parabola is real, the descent was two pieces glued where they meet, and the braking and the ignition height are inversely proportional. So the next time you watch a booster come home, you’ll know what its computer is solving all the way down, the same parabola you just built, with its vertex sitting right on the pad.