
Topic 3.14 key terms
- polar function
- A function r = f(θ) whose inputs are angle measures θ and whose outputs are radii r. Its graph is the set of points (r, θ): face the direction θ from the polar axis, then go r units along that line.
- pole
- The origin of the polar plane. Whenever f(θ) = 0 the graph passes through the pole, whatever the angle θ is.
- polar pattern
- A microphone's (or speaker's) sensitivity in every direction drawn as a polar graph: the angle from the front is the input, the sensitivity is the radius. An ideal cardioid mic has r = (1 + cos θ)/2.
- negative radius
- If f(θ) < 0, the point is plotted on the line of the terminal ray of θ but on the opposite side of the pole: face θ, then go |r| units backwards. For r = sin 2θ at θ = 3π/4, r = −1 and the point is (√2/2, −√2/2).
- restricting the domain
- Choosing an interval of θ so that only part of a polar graph is drawn. The endpoints are the angles where that piece starts and stops, which may not be the directions where the piece lies (r = sin 2θ draws its lower-right petal for π/2 ≤ θ ≤ π).
- change in input / change in output
- In r = f(θ), a change in the input θ is a change in angle from the polar axis; a change in the output r is a change in signed distance from the pole. When r is positive, an increasing r means moving away from the pole, not moving up (when r is negative, increasing r moves the point toward the pole).
Transcript
2,359 words · 7 parts
Soundcheck
Every concert starts like this, hours before anyone arrives, with an empty theater, a few work lights, and one microphone waiting in the middle of the stage. And then somebody bumps the stand. You’ve definitely heard that sound before. It was probably at a school assembly, right when the principal walked in front of the speakers.
That sound is feedback. The microphone hears its own speaker, sends it back out louder, then hears it again, and a fraction of a second later the whole system is screaming. And the strange part is that the same microphone, pointed the other way, ignores that speaker almost completely, even though it’s sitting right there on the floor, just a couple of steps away.
So this mic must hear some directions much better than others. Now imagine you could see how well it hears in every direction at once. This is what you’d see. Sound engineers call this shape the mic’s polar pattern, and they read these graphs to decide where every speaker on a stage is allowed to go. And look where the wedge is sitting.
By the end of this lesson, you’ll be able to read a graph like this one, even for a microphone you’ve never seen before. And you’ll put the speakers in the exact spots where it can’t hear them, so it never screams. So let’s find that shape ourselves, by walking a speaker all the way around this mic and listening.
One angle in, one radius out
Here’s the stage from straight above. There’s a ring taped on the floor, two meters out from the mic. And the line marked front is the way the mic is pointing. We’ll name every direction by its angle from that front line, our polar axis, turning counterclockwise like an angle in standard position, so the front is zero and straight behind the mic is pi.
Our test speaker starts right in front. It plays one short sound, and the meter says the mic heard it at full strength, which we’ll call one. To turn that reading into a point, we face the speaker’s direction, zero, go out from the mic as far as the reading says, one whole unit, and leave a dot there.
At pi over three, the mic hears the same sound, from the same distance, at only three quarters strength, so this dot goes three quarters of the way out along that direction. At pi over two, straight off to the side, the reading is one half. And notice where the dot goes, halfway out along that side line, while the speaker itself is still way out on the ring.
At two pi over three, the reading drops again. The mic hears only a quarter. And at pi, directly behind the mic, past the wedge, the meter barely moves. The reading is zero, so the dot doesn’t go out anywhere. It sits right on the mic, at the center of the chart, and that center is called the pole.
The speaker didn’t move, of course, it’s still two meters behind the mic. The dot just charts how loud each direction sounded, and from straight behind it sounded like almost nothing. The mic is the same on both sides, so the other half of the ring gives the same readings. That means we can drop those dots straight away.
Now join the dots in order, from zero all the way round to two pi, and there’s the shape this kind of mic is named after. Cardioid means heart-shaped, and you can see why. And that’s a polar graph. Every point came from one pair of numbers, an angle in and a radius out. And the curve is all of those pairs at once.
Okay, now you try it. Roll the speaker around the ring. Park it where the mic hears it at only a quarter of full strength. Let’s lift that chart off the floor. Then over to the board.
Here’s our chart on the board. And here are the readings, each input angle with the radius that came out. Five angles in, five radii out. For an ideal mic like this, here’s the rule. The radius r equals one plus cosine theta, all over two.
Let’s check it at pi over three. Cosine of pi over three is one half, so we get one plus a half, over two, and that’s three halves over two, which is three quarters, just what the meter said. So to plot any point of a polar graph, you face the direction theta. Then you go out a distance r along that line.
Two pictures of one function
There’s a second way to draw this same function, the way you’ve drawn every function so far, with the input theta along the horizontal axis and the output r going up. Drawn that way, the very same readings make a wave, starting at one, sliding down to zero at pi, and climbing back up to one at two pi. So which one is the graph? They both are, because it’s one function drawn two ways, and the useful skill is reading one picture off the other.
Let’s move along them together, slowly. Moving to the right on the wave means turning counterclockwise, and moving up on the wave means the point gets farther from the pole. So as the wave slid down from one to zero, the point slid in toward the pole, and when the wave touches zero at pi, the point on the polar graph is sitting at the pole, and that’s the mic’s blind spot, straight behind it.
Here’s one for you. As theta goes from pi to three pi over two, the wave rises from zero to one half. Which way is the point on the polar graph moving?
So be careful with the word increasing. On a polar graph, when r is positive, an increasing r means moving away from the pole, and which way that is on the page depends completely on the angle. Here’s how to say it on the AP exam. A change in theta is a change in angle, and a change in r is a change in distance from the pole, with a sign attached, and that sign is about to matter.
Behind the pointer
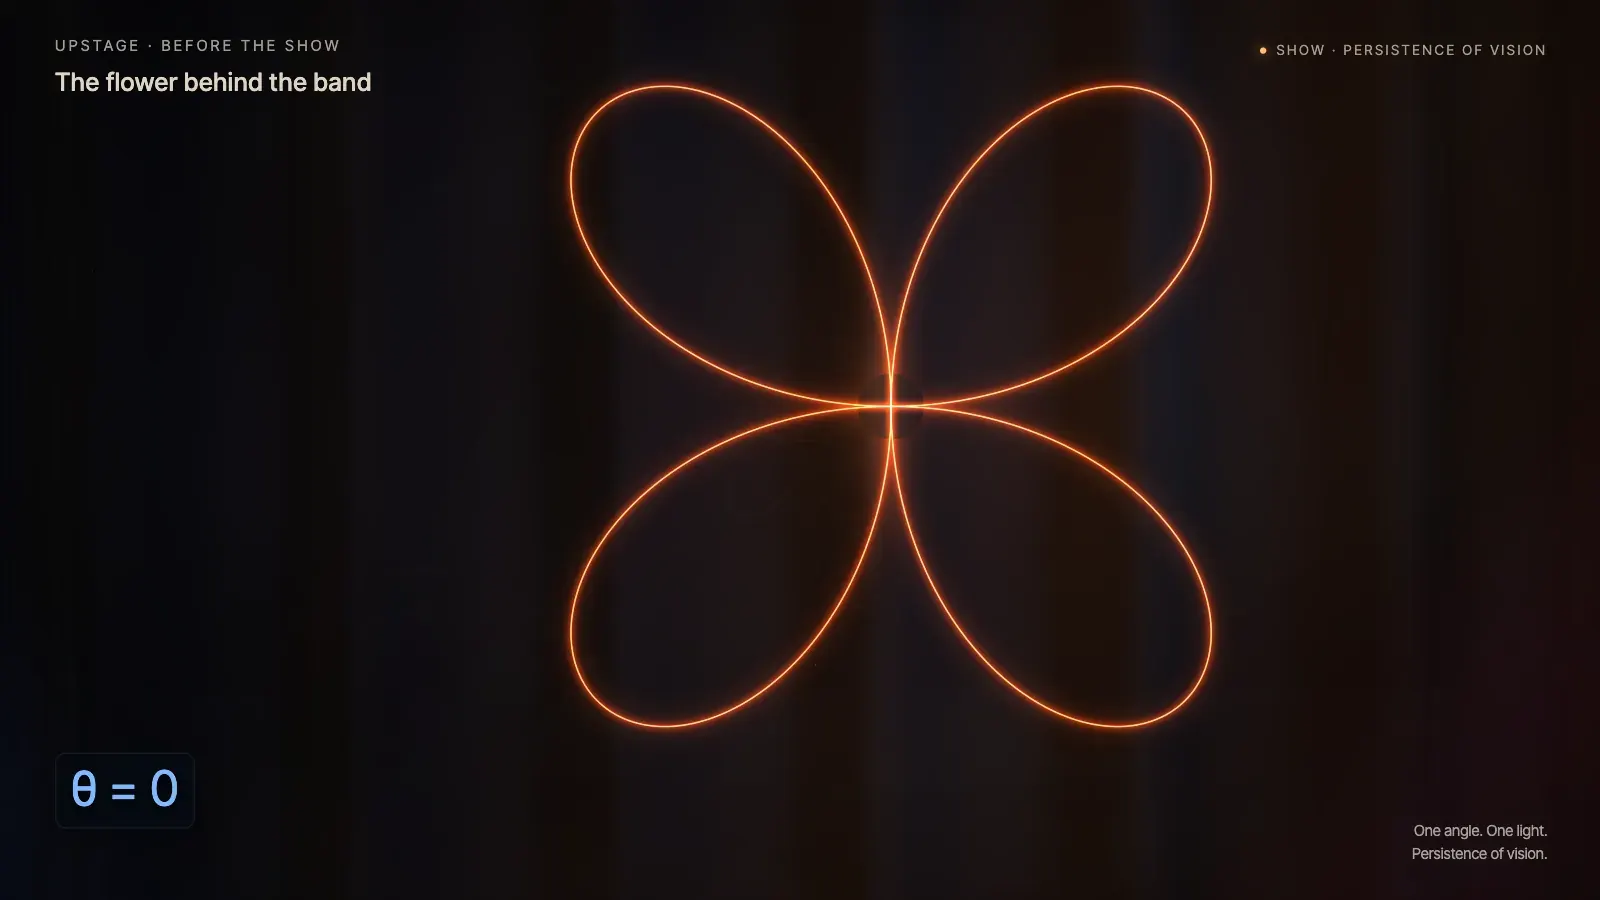
Later that night, the band has something hanging behind them. It’s a flower made of light. And it seems to float in the air, all by itself. It’s one of those spinning LED fans people call hologram fans, though there’s no hologram involved. Slow this one way down, and it’s just one bar of lights spinning through its middle with one light on at a time, and at full speed your eye blurs them all into one picture.
The bar’s front end, the one with the blue tip, points in a direction theta, and the fan decides which light along the bar to switch on, and how far out that light sits is r. Keep the same light on all the way round. And what do you get? A circle. Now let’s give it a real rule, r equals sine of two theta.
As the bar sweeps from zero to pi over two, r grows from zero up to one at pi over four, where two theta is pi over two. Then it falls back to zero, so it draws one petal right where the bar is pointing. At pi over two, sine of two theta is back to zero. So the light is sitting right in the hub. Next, the bar sweeps on. It’s heading into quadrant two.
Over to you. Where do you think the flower’s next petal will show up? Watch the light. As the bar turns past straight up, the light slides right through the hub and out the back of the bar. And a petal starts growing down in the lower right.
Let’s freeze the bar right there, at three pi over four. The bar points up and to the left, but two theta is three pi over two, and the sine of that is negative one, so the light is one whole unit out the back end, down and to the right. That’s what a negative radius means. You still face the angle theta, but then you go backwards, the same distance, out the other side of the pole.
Let it run on. The light comes back through the hub to draw a flower petal in the lower left. Then it goes negative again for the last one, up in quadrant two. So the petals arrive in this order, upper right, lower right, lower left, upper left, and if we spin it back up to full speed, it’s a flower again.
Here’s the same rule drawn the ordinary way. Between zero and two pi, sine of two theta makes two humps above the axis and two dips below it. And each piece of the wave draws one petal. The humps, where r is positive, draw petals where theta points, and the dips, where r is negative, draw them on the opposite side.
To sketch this by hand, you do what the fan does, pick some angles, work out r, and plot them in order. For the first petal, r goes zero, about point seven one, then one, then point seven one, and back to zero. And the point we froze at three pi over four, with r equal to negative one, has x equal to r cosine theta, from last lesson, so negative one times negative root two over two, which is root two over two.
And y equals r sine theta, negative one times root two over two, which is negative root two over two, so the point is down in the fourth quadrant, just like we saw. There’s one more thing hiding in here. The wave repeats every pi, so you might expect zero to pi to draw the whole flower, but it only draws two petals, and it takes the whole way round, zero to two pi, for all four.
Draw just one petal
Back at the fan, the lighting designer wants something special for the first song, just one petal, the lower-right one, glowing on its own. Its controller has two handles on the theta axis. The fan only lights up while the bar is between them. Now set the two handles so the fan draws only the lower-right petal. Nothing else should light up.
So when you restrict the domain of a polar function, you’re choosing the angles that do the drawing. And the piece they draw can end up somewhere else entirely. Give it zero to pi and you get two petals, and the whole flower needs zero to two pi.
Here’s one more, r equals two sine theta. At zero, r is zero, at pi over six it’s one, at pi over two it’s two, at five pi over six it’s one again, and at pi it’s back to zero. Plot those in order and they make a circle sitting on top of the pole, and look, it’s already finished by the time theta reaches pi, after only half a turn.
So what happens after pi? At seven pi over six, r is negative one, so we face seven pi over six and go backwards one unit, which lands exactly on the point we drew at pi over six. In fact, the whole second half-turn draws the same circle again, right on top of itself. So if you want this circle drawn exactly once, you restrict theta to the interval from zero to pi, and any other half-turn would work just as well.
Any graph at all
None of this needs a curve with a name. Here’s a graph that’s just a straight line, r starting at two when theta is zero and falling steadily to negative two at pi. Reading it every quarter of pi, r is two, one, zero, negative one, and negative two.
Now plot them in order, two along zero, one along pi over four, then the pole at pi over two, and the negative ones land behind their directions, over on the right-hand side. Connect them in order, and you get a loop that goes through the pole. It closes up right where it started, because negative two at pi lands back on the point two, zero.
Now you try one. P and Q are the two points marked on the loop. Which interval of theta draws exactly the piece from P, through the pole, to Q?
This is exactly the shape of an AP question, one polar equation, four graphs, and no calculator. You don’t need to plot the whole thing, because a few easy angles and one fact about r usually settle it. Which of these could be the graph of r equals three minus two sine theta?
Showtime
A polar graph is every pair of an angle and a radius. You face theta, and then you go out r. If r is negative, you go backwards, through the pole to the other side, and wherever r is zero, the point sits right at the pole. Changing theta turns you, changing r moves you toward or away from the pole, and to draw just one piece, you restrict theta to the angles that draw it. And now, it’s nearly showtime.
The doors open in a few minutes. And the singer has brought a different microphone. It’s a tighter kind than the one we measured before. All we have is its graph, drawn the ordinary way, sensitivity against the angle from its front. And there are two wedges this time, and each has to sit where this mic can’t hear, or the first song starts with a scream.
So read the graph first. Then drag both wedges to the spots where this microphone can’t hear them. And there’s this mic’s polar pattern. A big lobe in front, a small bump at the back, and two blind spots, with both wedges sitting right in them.
Now we’re ready. You just read a graph for a microphone you’d never seen before and put every speaker exactly where it can’t hear them, which is what a sound engineer does before every concert you’ll ever go to.