
Topic 3.5 key terms
- sinusoidal function
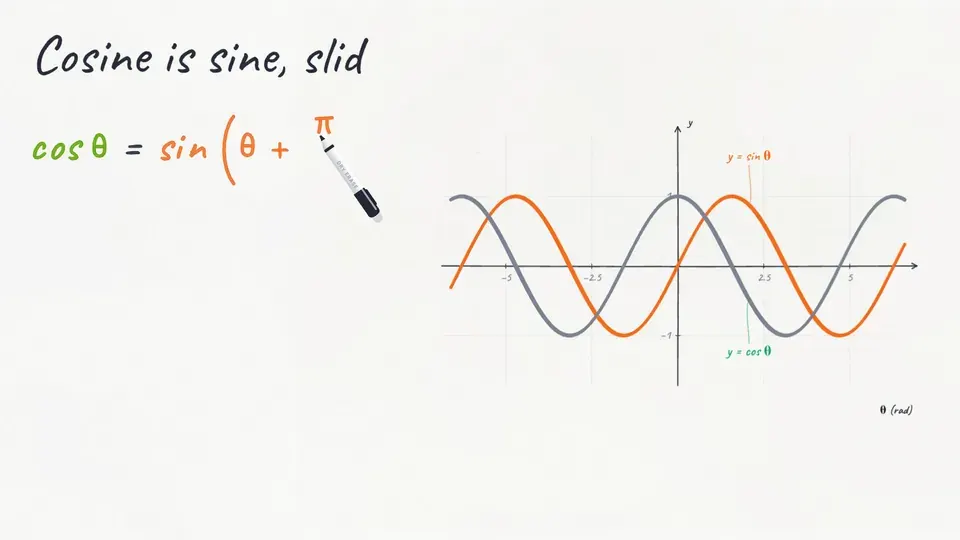
- Any function you can get from f(θ) = sin θ by additive and multiplicative transformations: stretching or squashing it, flipping it, and sliding it left, right, up or down. Sine and cosine are both sinusoidal, because cos θ = sin(θ + π/2).
- amplitude
- Half the difference between the maximum and minimum values of a sinusoidal function: how far the graph gets from its midline, either way. For y = sin θ and y = cos θ the amplitude is 1.
- midline
- The horizontal line at the average of the maximum and minimum values. For y = sin θ and y = cos θ the midline is y = 0; a wave from 2 to 6 has midline y = 4.
- period
- The length of one full cycle: the smallest input change after which the function is back at the same value moving the same way. The period of sin θ and cos θ is 2π.
- frequency
- The number of cycles per unit of input. Frequency and period are reciprocals: f = 1/P. The frequency of sin θ and cos θ is 1/(2π).
- concave down / concave up
- A graph is concave down where its rate of change is decreasing and concave up where its rate of change is increasing. A sinusoid is concave down above its midline and concave up below it, switching where it crosses the midline.
- odd function
- A function with f(−x) = −f(x) for every x; its graph has rotational (half-turn) symmetry about the origin. y = sin θ is odd.
- even function
- A function with f(−x) = f(x) for every x; its graph is symmetric across the y-axis. y = cos θ is even.
Transcript
2,029 words · 9 parts
Copper rain
Before we do any math at all, just watch this for a few seconds. In Singapore’s Changi Airport there’s a sculpture called Kinetic Rain, twelve hundred and sixteen copper-plated drops, each one hanging on a thin steel wire from its own little motor, and all day they ripple over the people waiting for their flights. We built our own version of it right here, and I want you to notice something a little strange about it.
Not one of these drops ever moves sideways. Every single drop just goes up and down, smoothly, over and over, and the wave you see rolling across is only the neighbors doing the exact same thing a moment later.
Now look at this row over here. It goes just as high as the others and just as low, it even keeps the same beat, and still your eye knows right away that something’s wrong with it.
And now it’s stopped completely, and all we have left is a graph of what it’s supposed to be doing. By the end of this lesson, you’ll be able to read a wave straight off its graph, where its middle is, how far it swings, how often it repeats and how it bends, and use that to bring this row back to life. To get there, we only need to understand what one single drop is doing, so let’s pick one and follow it.
One drop
Let’s stand a ruler next to this drop to read its height above the floor, and every half second, we’ll leave a little glowing mark wherever the drop is. Now slide those marks out sideways, so time runs from left to right, and the drop draws its own graph, starting at four meters, up to six, back down through four to two, and up to four again. And then it does the whole thing again, every eight seconds.
Here’s that graph on the board, and if this wave looks familiar, it should, because it has the shape of the sine curve you built last lesson from the unit circle. This is plain sine, if we let its input be seconds, and if we stretch it twice as tall, slide it up four meters, and slow it down so that one cycle takes eight seconds, it lands right on top of our drop.
That’s what the word sinusoidal means. A sinusoidal function is any function you can get from sine by stretching it, squashing it, flipping it or sliding it, which in algebra means multiplying and adding. Now here’s the kind of motion that broken row was making, drawn with our drop’s numbers, the same top, bottom and eight seconds. It even crosses the middle at the same moments, but it’s straight lines, with a sharp corner at every turn.
No stretching or sliding will ever put a corner into a sine curve, so the zigzag repeats, but it isn’t sinusoidal. That’s what your eye caught, because a real drop eases into every turn, and the zigzag slams into it at full speed.
How big, and around what?
So how big is this wave? A lot of people would say six meters, because that’s the highest the drop ever goes. But imagine we hung the whole sculpture a meter higher. The wave would be just as big, and yet its top would be at seven, so the top alone can’t tell us how big the wave is.
From its lowest point at two meters to its highest at six, the drop travels four meters, and halfway along that trip, at four meters, is the middle. The amplitude is how far the drop gets from that middle, two meters either way, and the middle level itself, the horizontal line at four meters, is what we call the midline.
On the board, the amplitude is half the distance between the maximum and the minimum, so six minus two is four, and half of that is two meters. And the midline is the average of the maximum and the minimum, six plus two is eight, and half of eight is four, so the midline is the line h equals four. The floor is still h equals zero. The midline is wherever the wave is centered, and that doesn’t have to be the floor or the axis.
For plain sine and cosine, the highest they get is one and the lowest is negative one, so their amplitude is one and their midline is y equals zero, which is why they’re centered right on the axis. Let’s try a wave that has nothing to do with drops, with its highest and lowest values marked. What’s the amplitude of this wave?
How often?
Next question, how long does one cycle take? This blue bracket starts as the drop passes the middle going up, and the ghost shows where the drop is at the bracket’s other end. Drag the end of the bracket until it covers exactly one full cycle of this drop.
That length, one full cycle, is the period you met with the pulsar, and here it’s eight seconds. The test is always same height and same direction, because almost every height comes up twice in a cycle, once going up and once coming down.
There’s a second way to say how often it repeats. In thirty-two seconds the drop goes through four full cycles, so each second it gets through an eighth of a cycle. We call that the frequency, one eighth of a cycle per second. The period is seconds per cycle and the frequency is cycles per second, so each one is just the other one flipped upside down.
For sine and cosine themselves, one cycle takes two pi, so their period is two pi and their frequency is one over two pi, about point one six cycles per unit of input. Here’s one for you. A drop in another sculpture makes three full trips up and down every twelve seconds. What’s its frequency?
How it bends
Now let’s photograph the drop once every second and spread the photos out. Look how they bunch up near the top, and spread out through the middle. So the drop moves slowly near the top, where it turns around, and fastest as it passes the middle. From four seconds to five, it fell about one point four one meters. In the next second, from five to six, how far do you think it’ll fall, compared with that one point four one meters?
Let’s put real numbers on that. Here are the drop’s heights once every second, for one whole cycle, four, then five point four one, six, five point four one, four again, then two point five nine, two, two point five nine, and back to four. Now the change each second. From zero to one, the height goes from four to five point four one, a change of plus one point four one.
Every other change works the same way, the next height minus the one before it, all the way down the table. In the first two seconds the drop is rising, but it rises less each second, one point four one and then point five nine, so its rate of change is decreasing.
Through the top, the changes keep dropping, plus point five nine, minus point five nine, minus one point four one, so the rate keeps decreasing even after rising turns into falling. When the rate of change is decreasing, the graph is concave down, shaped like an upside-down bowl, and that’s the whole top half of the cycle, from zero to four seconds.
Below the midline it flips. From four to six the drop is still falling, but each second it falls less, so its rate of change is increasing, from minus one point four one up to minus point five nine, and the graph is concave up. Through the bottom the changes keep climbing, to plus point five nine and then plus one point four one, so the rate keeps increasing, and it’s concave up all the way from four to eight seconds.
Put those together and you get the rule for every sinusoid. Above the midline it’s concave down, and below it, concave up, so the curve is always bending back toward the middle, switching right where it crosses the midline.
This is exactly how the exam asks it. Which of these is true about h on the interval from two to four seconds?
Cosine is sine, slid
Let’s light up one more drop, four drops to the left of ours in the same row. It’s at its top right when ours passes the middle, and its graph is the same curve, two seconds ahead. Slide our drop’s graph two seconds to the left, and it lands right on its neighbor’s. Two seconds out of an eight second cycle is a quarter of a cycle.
The same thing happens with sine and cosine. Take a copy of sine and slide it to the left by pi over two, which is a quarter of its two pi cycle, and it lands exactly on cosine.
So cosine of theta equals sine of theta plus pi over two. Cosine is just sine started a quarter of a cycle early, which means cosine is a sinusoidal function too. You can check one point. Cosine of zero is one, and sine of pi over two is one, the same peak, a quarter of a cycle apart.
Turn it, flip it
Here’s sine etched on a sheet of glass, with a pin right through the origin. Let’s turn the whole sheet half a turn around that pin. The curve lands exactly on top of itself. Every peak on the right lands where a valley was on the left, and the two dots trade places.
Now cosine. This time, flip the glass over the y-axis, like turning a page. And cosine lands on itself too. Swap the moves and it fails. Turn cosine half a turn and it comes out upside down, and flip sine over the y-axis and it comes out upside down too.
Here’s the same thing in numbers. Sine of pi over six is one half, and sine of negative pi over six is negative one half, but cosine gives root three over two for both of them.
So sine of negative theta equals negative sine of theta. We call a function like that odd, and its graph has that half-turn symmetry about the origin. And cosine of negative theta equals cosine of theta, so cosine is even, with mirror symmetry across the y-axis. Those are the words you met with polynomials in Unit 1, where x squared is even and x cubed is odd.
But careful, the symmetry belongs to the exact function, not the whole family. Here’s sine slid up two units. So what about g of theta equals sine theta plus two? Which of these is it?
What to remember
So here’s everything we can read off a wave. A sinusoid is sine stretched and slid, smooth at every turn. The amplitude is half the distance from the maximum to the minimum, and the midline is the line halfway between them.
The period is one full cycle, same height and same direction, and the frequency is one over the period. Above the midline it’s concave down, and below it, concave up. Sine is odd, cosine is even, and cosine is just sine slid a quarter of a cycle to the left. So now let’s go fix that row.
Bring it back
Here’s our broken row, hanging still, and the graph of what it’s supposed to do. The four controls set its middle, its swing, which is its amplitude, the seconds per cycle, and whether it moves smoothly or at a constant speed.
It’s a different wave from our drop, so read the graph first. Then set the four controls so this row moves exactly the way the graph says, and bring it back to life.
And the row slides right back into the wave, as if it had never stopped. A middle, a swing, a rhythm and the right shape, and you read every one of them straight off a graph. Next lesson, you’ll write a wave like this as a formula, and change it on purpose.